Price ($)
^
1200| /--\
| / \
1000| /----/ \ (Historical ATH Spike)
| / \
900| >---* (Current: $881)
|_________________________> Time (Jan 2026)
As of January 25, 2026, BNB (Binance Coin) continues to be a top-tier asset in the crypto market, serving as the backbone of the Binance ecosystem and the high-performance BNB Chain.
Below is a breakdown of its current status, technical performance, and what to expect next.
📊 Market Snapshot (Jan 2026)
BNB is currently showing resilience after hitting a major all-time high late last year.
Current Price: ~$881 - $886 USD
Market Cap: ~$120.35 Billion
24h Volume: ~$1.58 Billion
All-Time High (ATH): $1,376.26 (Reached October 12, 2025)
Visualizing the 2026 Trend (January)
The following describes the recent performance and technical outlook for BNB (Binance Coin) as of late January 2026, accompanied by a detailed candlestick analysis.
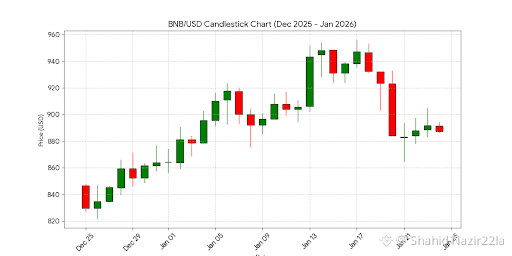
BNB Market Analysis (Dec 2025 – Jan 2026)
Over the past month, BNB has exhibited a "stair-step" recovery followed by a healthy correction. After the massive rally of 2025, the token found a solid floor in the $830 range during late December. By mid-January 2026, it reached local highs of approximately $950, driven by anticipation of the upcoming Fermi hard fork and continued high-volume activity on the BNB Chain.
Key Technical Observations:
Peak Resistance: The $950 level acted as a major resistance zone. Three consecutive attempts to break above $955 were rejected between January 13th and 17th.
Support Strength: The price currently sits near a strong support cluster around $880. This area is critical for maintaining the current bullish structure.
Volatility: A sharp 4.2% drop on January 20th signaled a "flush out" of late long positions, likely a reaction to broader market profit-taking.
Technical Breakdown of the Graph
Green Candles: Indicate days where the price closed higher than it opened, showing buying pressure (notably strong between Jan 4th and Jan 13th).
Red Candles: Indicate selling pressure. The large red candle on Jan 20th highlights the significant rejection from the $930 resistance.
Wicks: The long upper wicks seen in mid-January suggest that sellers are active whenever BNB approaches the $1,000 psychological milestone.
Summary Table: Recent OHLC Data