As of January 28, 2026 , Ethereum ($ETH ) is navigating a high-stakes "decision zone." After a volatile start to the month that saw prices swing between $2,800 and $3,350 , the asset is currently stabilizing around the psychological $3,000 mark.
+1
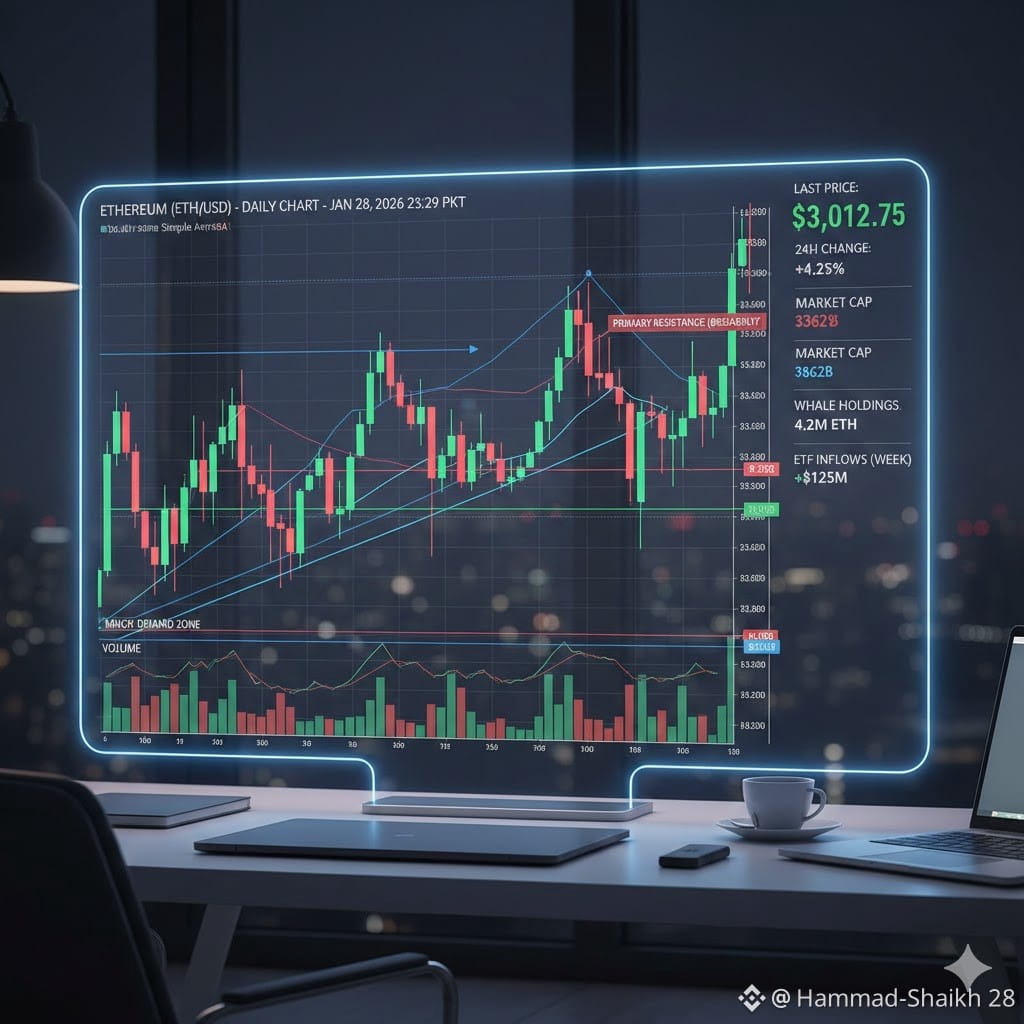
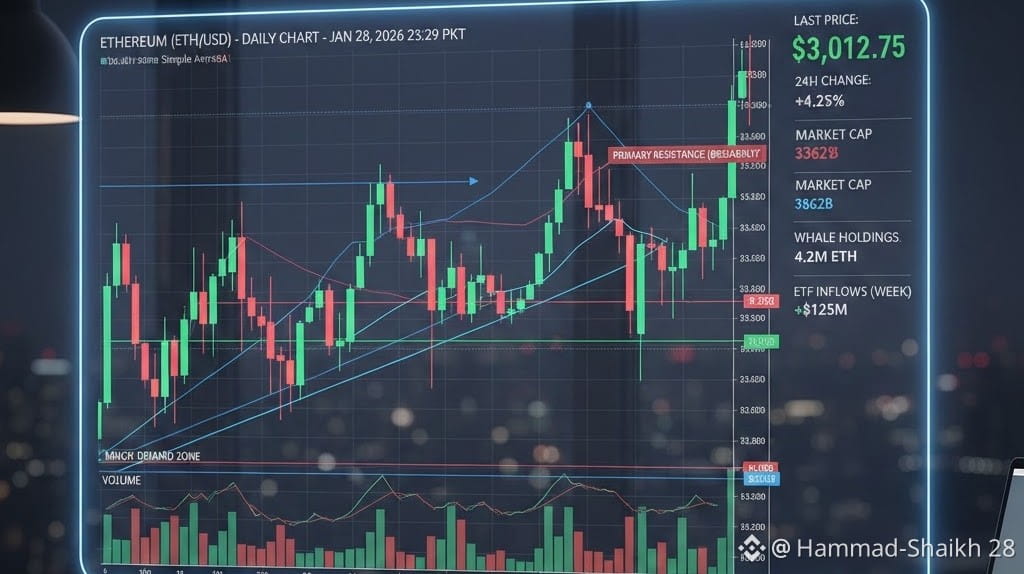
Technical Analysis: ETH/USD Candlestick View
The 2026 price action suggests Ethereum is currently trapped in a broad consolidation phase, but recent daily candles hint at a potential shift in momentum.
Current Candlestick Patterns
The "Hammer" Near Support: On January 27, a significant Hammer candle formed on the daily chart as the price dipped to $2,815 before aggressively bouncing back to close near $2,926 . This suggests strong buying interest (demand) at lower levels.
Bullish Engulfing (1-Hour/4-Hour): In the last 24 hours, ETH has printed bullish engulfing patterns on shorter timeframes, allowing it to reclaim the $3,000 level.
Ascending Triangle Formation: On the medium-term daily chart, $ETH is showing higher lows, forming the base of an ascending triangle. The "ceiling" of this structure remains firm at $3,400 .
Key Price Levels
Level TypePrice PointSignificancePrimary Resistance$3,350 – $3,400The "breakout" trigger; 2026 annual highs.Immediate Resistance$3,175Previous consolidation floor now acting as a ceiling.Pivot Support$2,980 – $3,000Psychological baseline for current stability.Major Demand Zone$2,800 – $2,850Critical support; A break below likely leads to $2,500.
Market Drivers & Sentiment
Institutional Accumulation: Significant on-chain data indicates that "whales" and institutional entities (like BitMine Immersion) have increased their holdings to over 4.2 million $ETH , signaling a long-term "supply squeeze" strategy.
ETF Inflows: Net inflows into Ethereum Spot ETFs have remained positive this week, providing a steady bid even during broader market pullbacks.
Network Activity: The "burn rate" has spiked as Layer 2 activity hits record highs in early 2026, creating deflationary pressure that supports the price floor despite macro-economic uncertainty.
Summary Outlook
Ethereum is currently in a "Wait and See" phase. While the long-term structure remains bullish (targeting a run towards $4,000 by Q2 2026), the short-term trend is neutral-to-bullish as long as it stays above $2,980 . A daily close above $3,175 would confirm the end of the January correction.

#FedWatch #VIRBNB #TokenizedSilverSurge #TSLALinkedPerpsOnBinance #ClawdbotSaysNoToken