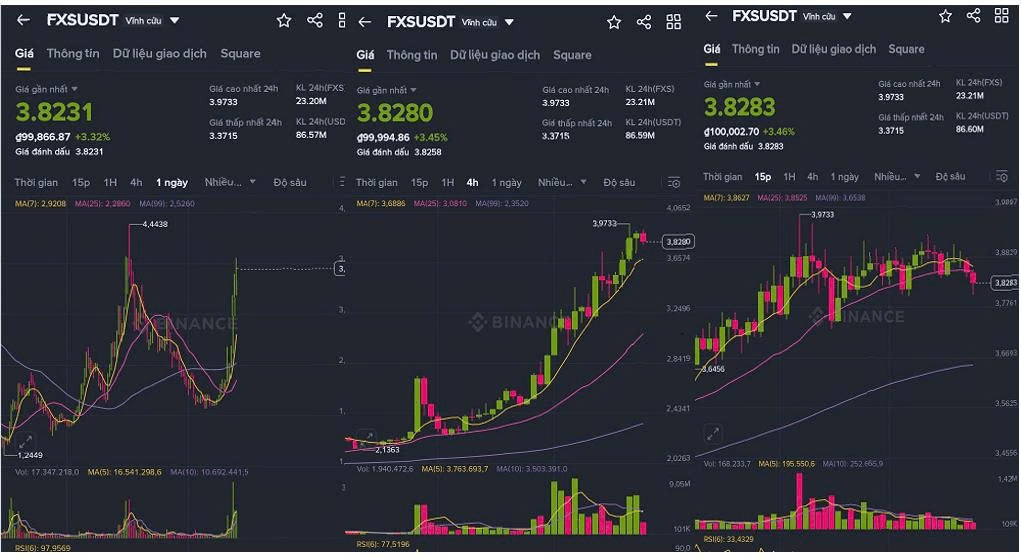
Analysis of FXS/USDT – 1D, 4H, 15P frames:
1. 1D frame (left chart)
Price rebounded strongly after the drop, the candle is significantly bullish, approaching the old peak area ~4.4.
RSI is not overbought yet but is rising strongly → FOMO sign.
There is a possibility of hitting strong resistance around the 4.0 - 4.4 area.
2. 4H frame (middle chart)
Price is skyrocketing, many consecutive green candles, RSI > 70 → clearly overbought.
Approaching the resistance area of 3.97 - 4.05.
Signs of starting to plateau, may create a short-term peak.
3. 15P frame (right chart)
Price is weakening, with a slight red candle appearing.
Volume is decreasing, buying pressure seems to be weak.
✅ Reasonable short strategy:
Short around 3.95 – 4.05 (near the old peak + technical resistance).
Stop loss above 4.45 (clearly surpassing the old peak).
Take profit expectation: 3.5 – 3.3 (nearby support area).
⏱ Note: Wait for a clear reversal signal at 4H or 15P (pinbar/engulfing bearish candle) before entering the trade.
#btc