

The crypto industry has been severely impacted by recent market volatility, with Bitcoin experiencing a precipitous drop that sent the asset below significant historical levels that had held steady since its last significant breakout. As Bitcoin slipped through areas that many traders thought would provide long-term structural support to the so-called digital gold, the decline rocked market confidence.
Shiba Inu avoids it
On the other hand, Shiba Inu has shown a fair amount of resilience over the same time frame. While SHIB continues to trade within a broader downtrend, its price action has not mirrored Bitcoin’s collapse into historically critical territory.
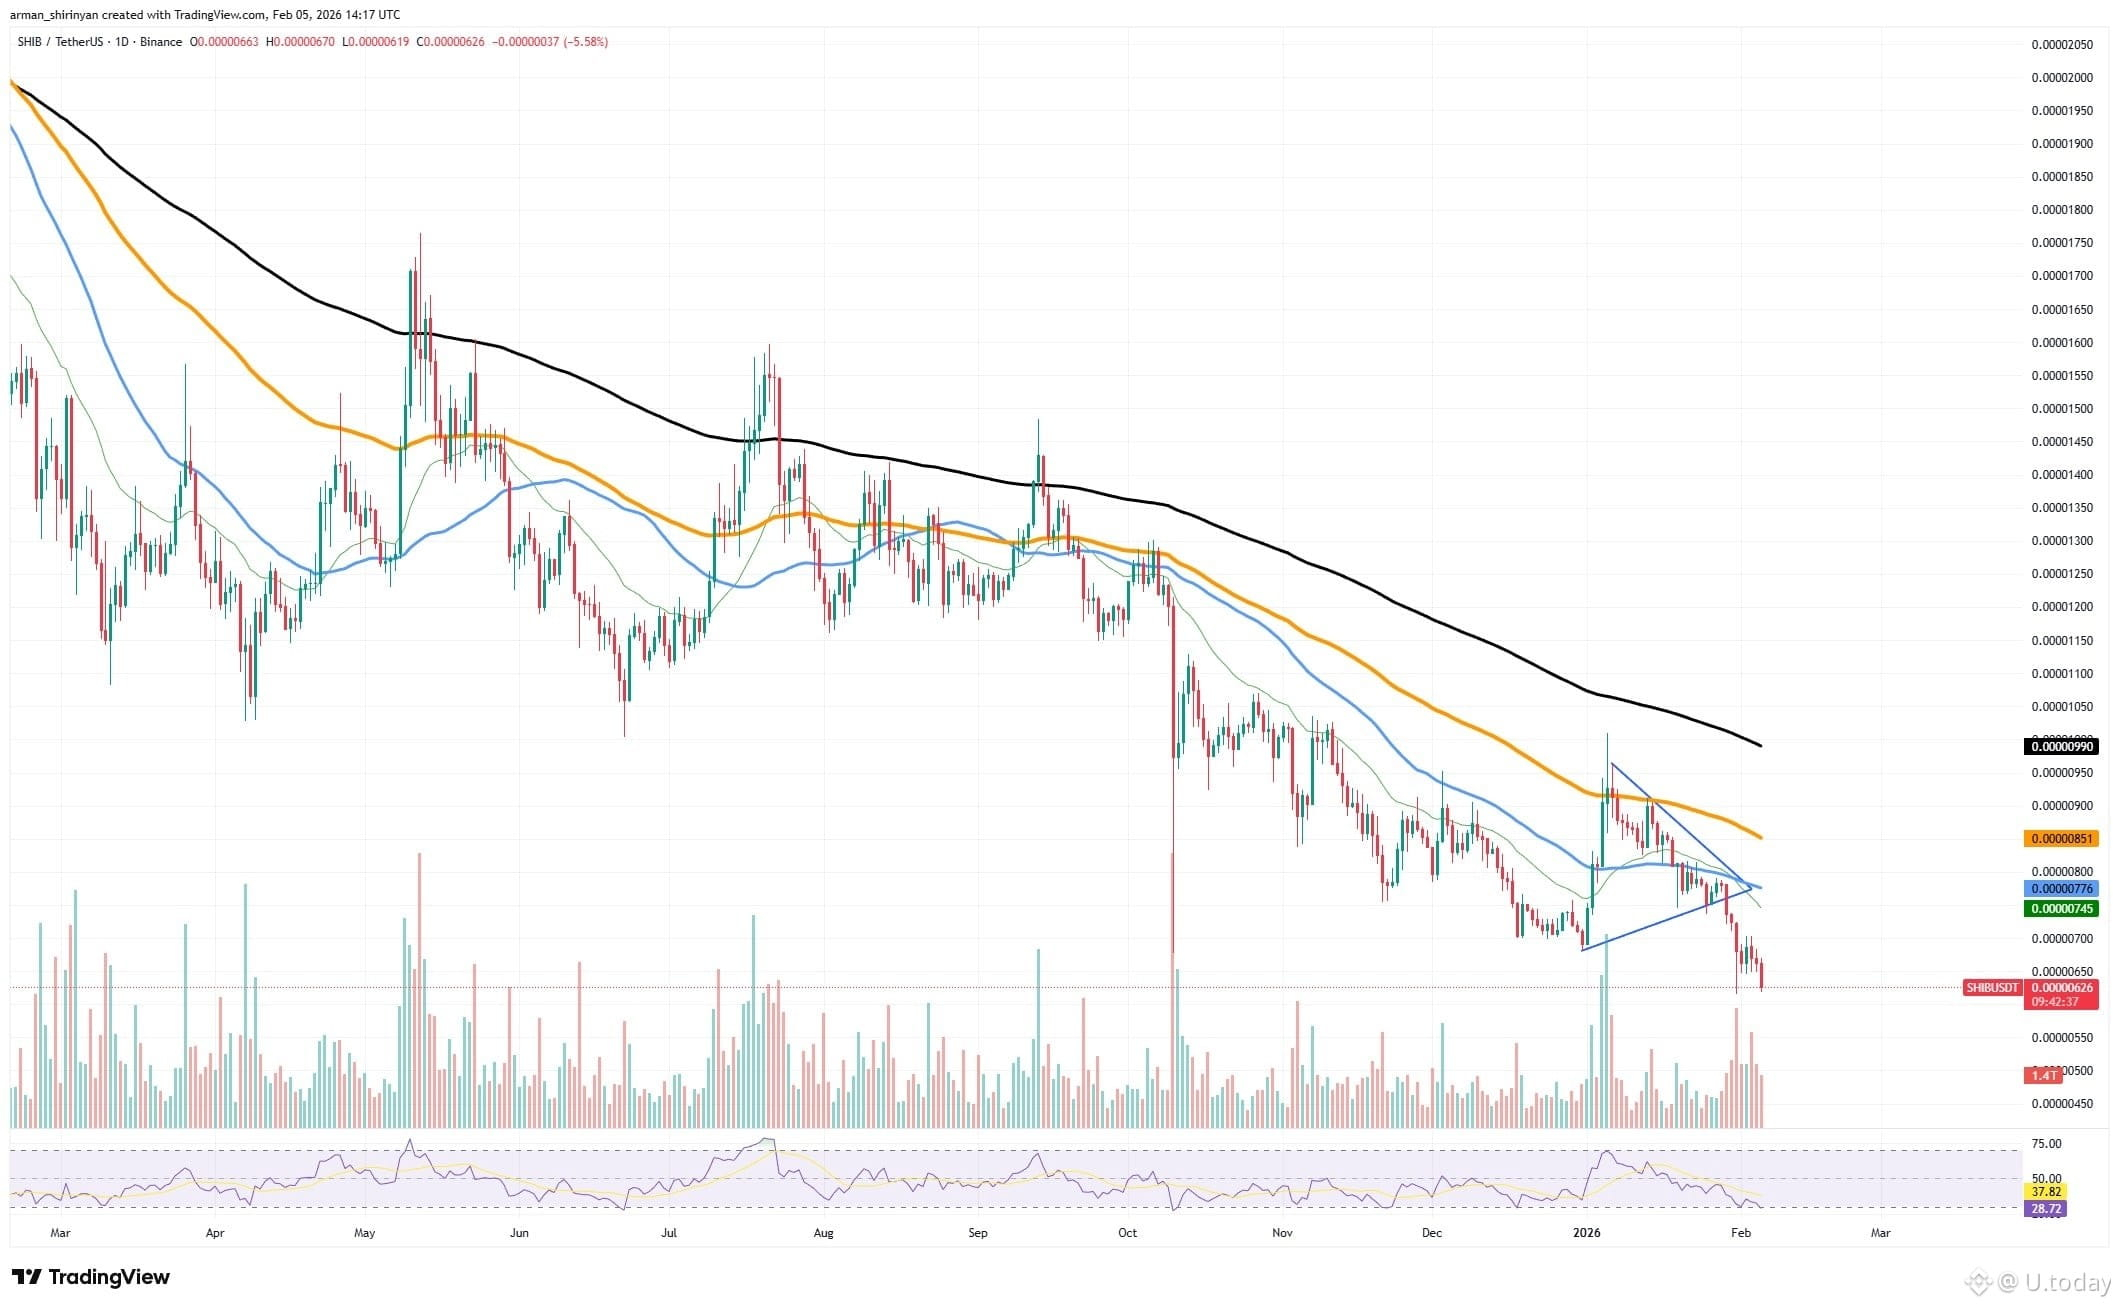
Rather than experiencing the kind of breakdown that drove Bitcoin below levels not broken since its previous bull cycle expansion, SHIB has been able to maintain its position above its most important structural support zones.
Comparing the behavior of structural charts with percentage drawdowns makes this relative strength more evident. Although significant, SHIB's decline stayed within previously defined market ranges, while Bitcoin's decline erased months of consolidation gains and led to significant liquidation events. In other words, rather than going into a new stage of historical breakdown, SHIB stayed within anticipated corrective boundaries.
A portion of this resilience stems from the fact that SHIB had previously been subjected to prolonged selling pressure, which had essentially compressed a large portion of the speculative premium prior to the most recent market-wide correction. Consequently, there was less excess leverage and speculative positioning to unwind than with Bitcoin, which had experienced a more vigorous rally before the decline.
Investors should not, however, confuse relative strength with a proven recovery. SHIB continues to encounter strong overhead resistance, and the mood of the market as a whole is still shaky. Short-term pressure on altcoins, including SHIB, could still result from any new weakness in Bitcoin.
Bitcoin's historic plunge
The decline in Bitcoin is being caused by a number of fundamental factors. First, there is a significant decline in the appetite for macro risk, as evidenced by the sell-off of tech and equity stocks, along with digital assets. Risk-off sentiment in stocks has resulted in pressure on Bitcoin and other significant tokens, renouncing the crypto market's separation from traditional financial markets.
Secondly, the sell-off has been made worse by leveraged positions and cryptocurrency liquidations. Numerous long positions were compelled to liquidate as the price broke crucial support levels, causing cascades that accelerated the momentum of the decline. According to derivatives data, there have been billions in Bitcoin and other cryptocurrency liquidations in the past week, further undermining market confidence.
card
Third, speculation has been impacted by expectations of monetary tightening and macroeconomic policy uncertainty. When investors reevaluate risk exposure in the face of tightening liquidity conditions, the U.S. dollar's strength and the nomination of a hawkish Federal Reserve chair have diminished the allure of high-beta assets like Bitcoin.
The technical state is also important. Now that the price has moved into a weaker support zone with little historical buy interest, Bitcoin may be tested further at lower levels if the current ranges do not hold. Going forward, it will be critical if Bitcoin can recover $70,000 and stay above it. Deeper corrections, perhaps in the mid-$60,000s or lower, could occur if this market fails to stabilize, particularly if macro headwinds and capital flight from risky assets continue.
Ethereum under pressure
As the asset quickly approaches the structurally and psychologically significant $2,000 support zone, Ethereum is currently experiencing one of its most crucial technical moments in recent months. ETH has broken below several support levels and important moving averages following weeks of persistent selling pressure, indicating that bears are still in control of the market.
card
Price action clearly demonstrates that the downward trend that started when Ethereum was unable to sustain its strength above the $3,000 region earlier in the cycle has continued. There has been a series of lower highs and lower lows as a result of renewed selling following each recovery attempt.
The recent collapse below intermediate support zones sped up the decline, bringing ETH perilously near levels that could dictate the direction of the market in the medium term. Whether $2,000 can serve as a defensive line for buyers is currently the key question. This level that served as a pivot point during earlier market phases has both psychological significance and historical significance.
Given that daily momentum indicators are approaching oversold territory, Ethereum may experience at least a brief stabilization or relief bounce if buyers are able to intervene forcefully. However, there is still a high risk. The overall mood of the cryptocurrency market is still negative; altcoins are still under pressure from Bitcoin's decline, and capital flows continue to favor risk reduction over accumulation.
In the absence of a significant surge in demand or a more extensive market recovery, ETH might find it difficult to stay afloat. Deeper support levels in the mid-$1,800s or even lower zones could be reached if there is a clear breakdown below $2,000, which would probably lead to additional liquidations. However, if Ethereum is able to hold this level and recover resistance regions above $2,400-$2,500, market confidence may eventually rebound.