Quedas de Mercado em Baixa do BTC: Um Olhar Claro sobre os Ciclos do Bitcoin
O Bitcoin ($BTC) é conhecido por sua volatilidade, mas uma de suas características mais definidoras é a queda de mercado em baixa—períodos em que os preços caem acentuadamente a partir de máximas históricas. Embora essas fases possam parecer alarmantes, a história mostra que elas são uma parte normal e necessária do ciclo de mercado do Bitcoin.
### O que é uma Queda de Mercado em Baixa?
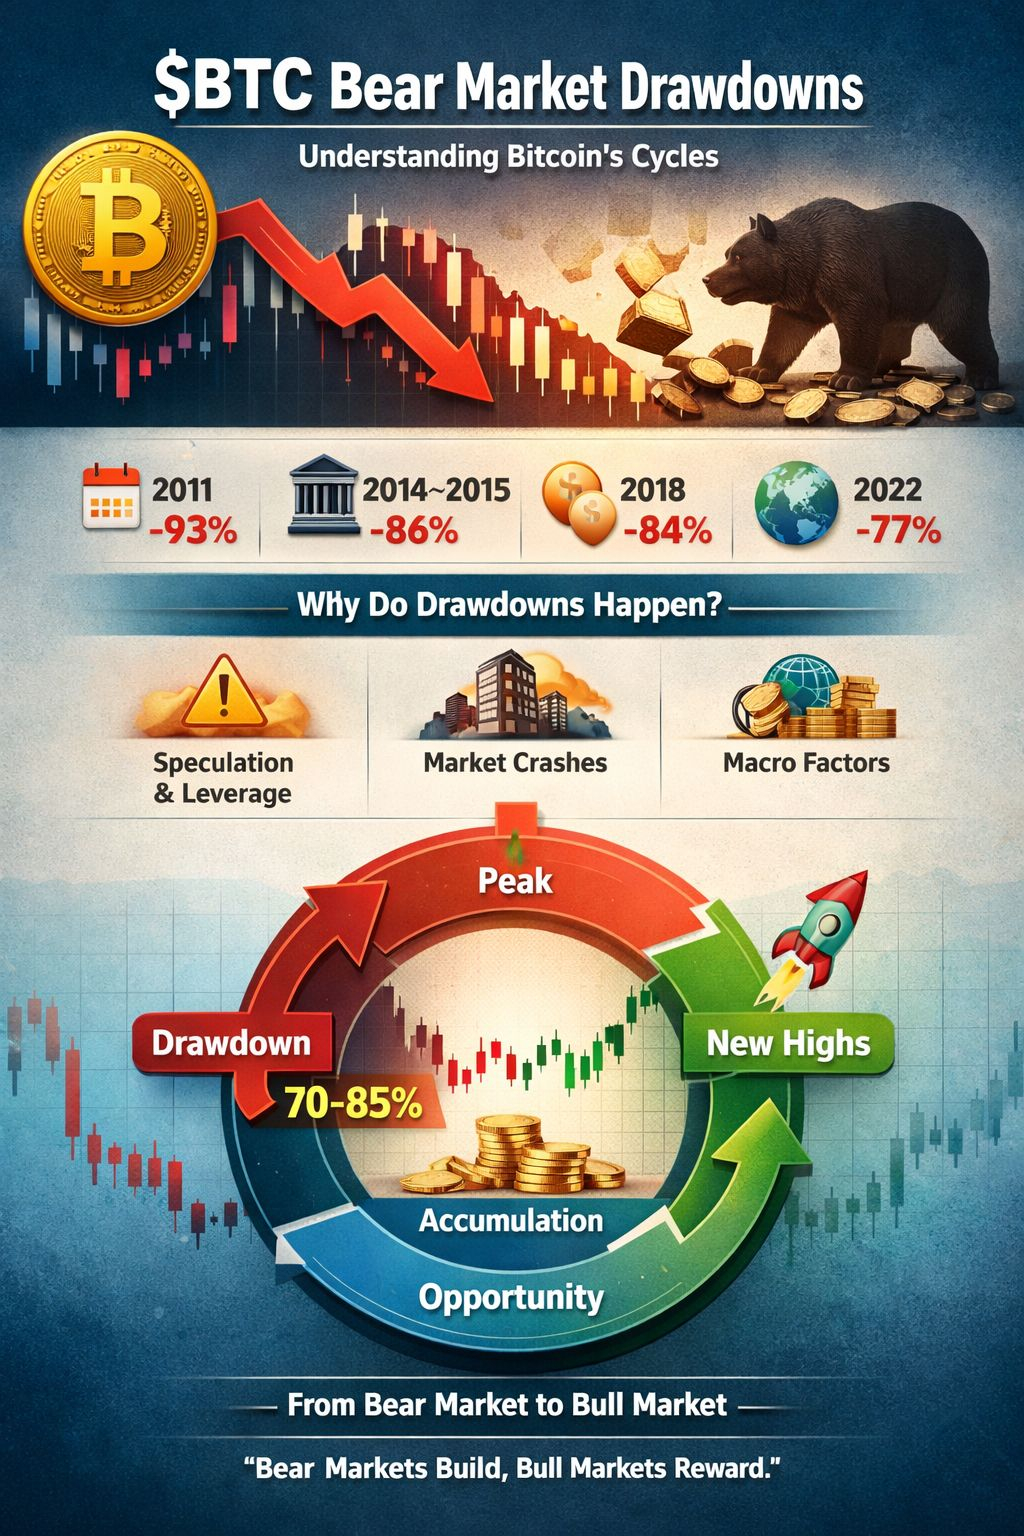
Uma queda de mercado em baixa refere-se à porcentagem de queda do pico do Bitcoin até seu ponto mais baixo antes que uma recuperação comece. Na história do Bitcoin, quedas de 70% a 85% ocorreram várias vezes.
### Correções Históricas do BTC
*2011:** ~93% de queda após o crescimento especulativo inicial
*2014–2015:** ~86% de queda após o colapso da Mt. Gox
*2018:** ~84% de correção após a bolha de ICO
*2022:** ~77% de queda em meio ao aperto global e estresse do mercado
Apesar dessas correções profundas, o Bitcoin se recuperou toda vez, eventualmente estabelecendo novas máximas históricas.
### Por Que Essas Correções Acontecem?
Os mercados em baixa do Bitcoin são geralmente impulsionados por:
* Alavancagem e especulação excessivas
* Aperto macroeconômico (taxas de juros, liquidez)
* Grandes falências na indústria ou vendas motivadas pelo medo
Essas fases atuam como um reinício do mercado, eliminando mãos fracas e alavancagem insalubre.
### Por Que Investidores de Longo Prazo Observam Correções de Perto
Para investidores experientes, as correções em mercados em baixa não são apenas riscos—são oportunidades. Historicamente, os melhores períodos de acumulação de longo prazo ocorreram durante correções profundas, quando o sentimento está em seu ponto mais baixo.
>> “Os mercados em baixa são onde a riqueza é construída; os mercados em alta são onde ela é realizada.”
### Principal Conclusão
As correções do mercado em baixa do Bitcoin não são um sinal de fracasso, mas uma prova de sua natureza cíclica. Cada ciclo seguiu um padrão semelhante:
Queda acentuada → consolidação → recuperação → novas máximas.
Compreender essa estrutura ajuda os investidores a permanecerem racionais, gerenciarem riscos e tomarem decisões informadas em vez de reagirem emocionalmente.


