Technical analysis indicates gold has completed a minor pullback and is positioning for a new advance. Key bullish reversals on both daily and weekly charts, supported by a rebound from Fibonacci and moving average support, set the stage for a potential breakout toward higher price targets.
Key Points :
Strong Rebound from Critical Support: Gold bounced decisively from a major 61.8% Fibonacci retracement level and reclaimed the key 20-day moving average, signaling a shift in momentum.
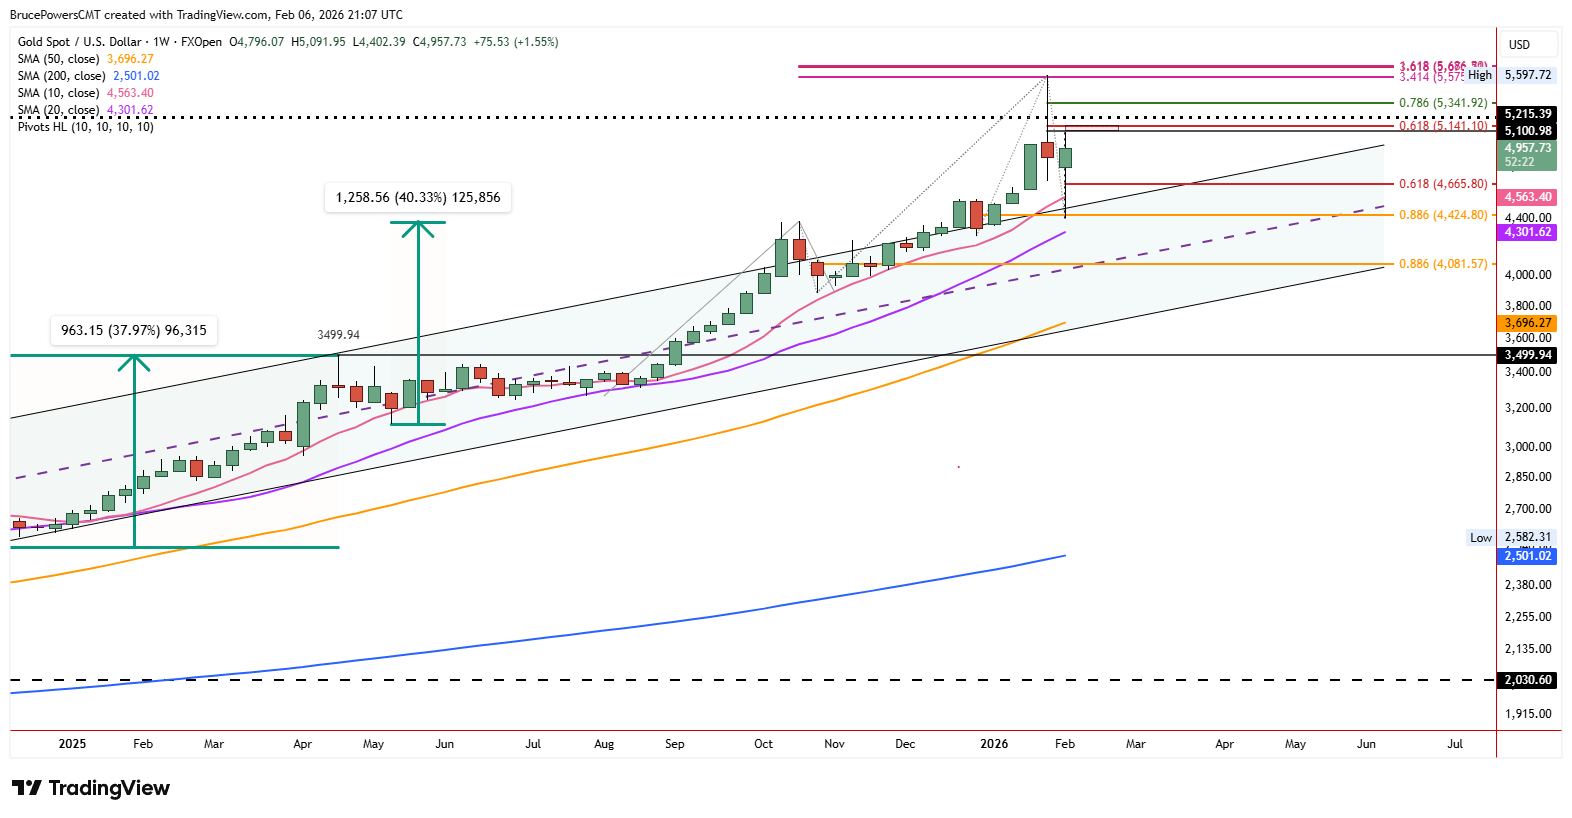
Bullish Chart Patterns Emerging: A potential rising "ABCD" pattern is developing on the daily chart, while the weekly chart is forming a powerful "bullish hammer" candlestick, both indicating a trend reversal to the upside.
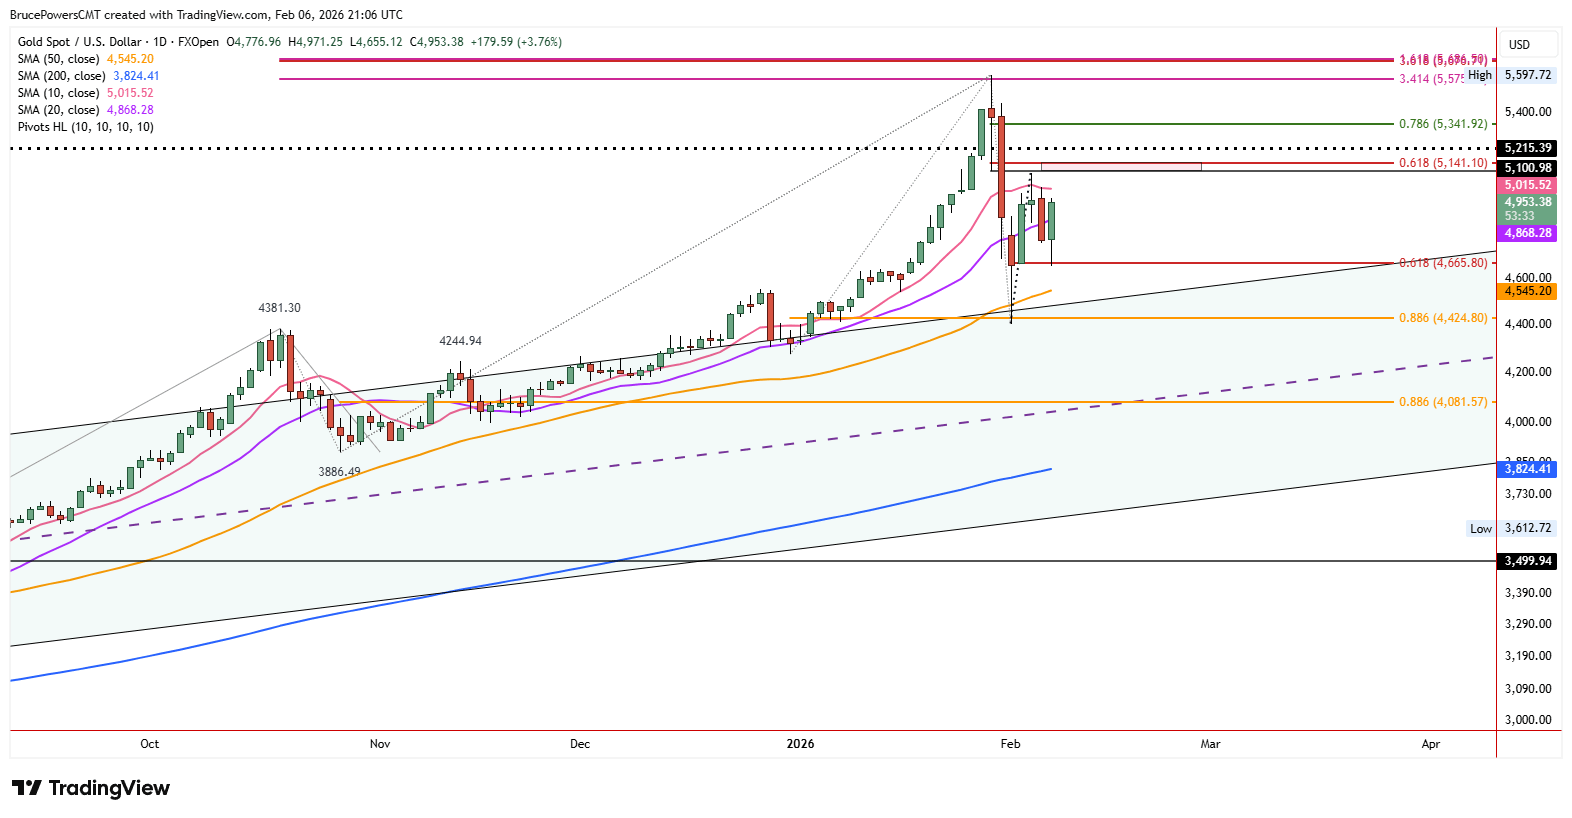
Breakout Threshold Identified: A sustained move above the recent swing high of $5,092 is needed to confirm the reversal and trigger the next leg higher.
Clear Upside Targets: Upon confirmation, immediate resistance targets lie at $5,141 (61.8% Fib) and then $5,342 (78.6% Fib).
Weekly Battle Resolved Bullishly: This week's bullish hammer pattern is countering last week's bearish "shooting star," suggesting the prior sell signal has failed and buyers are regaining control.