Vanar Chain (VANRY) Technical Analysis Article
Vanar Chain ( $VANRY ) is a low-market-cap cryptocurrency listed on Binance. Its recent price is around the $0.006 range according to Binance real-time data.
Trend Overview

Technical readings for VANRY are currently mixed across platforms. Some indicators show sell pressure while others show potential strength in short-term momentum. This mixed picture means neither bulls nor bears are fully in control right now.
Technical Indicator Signals
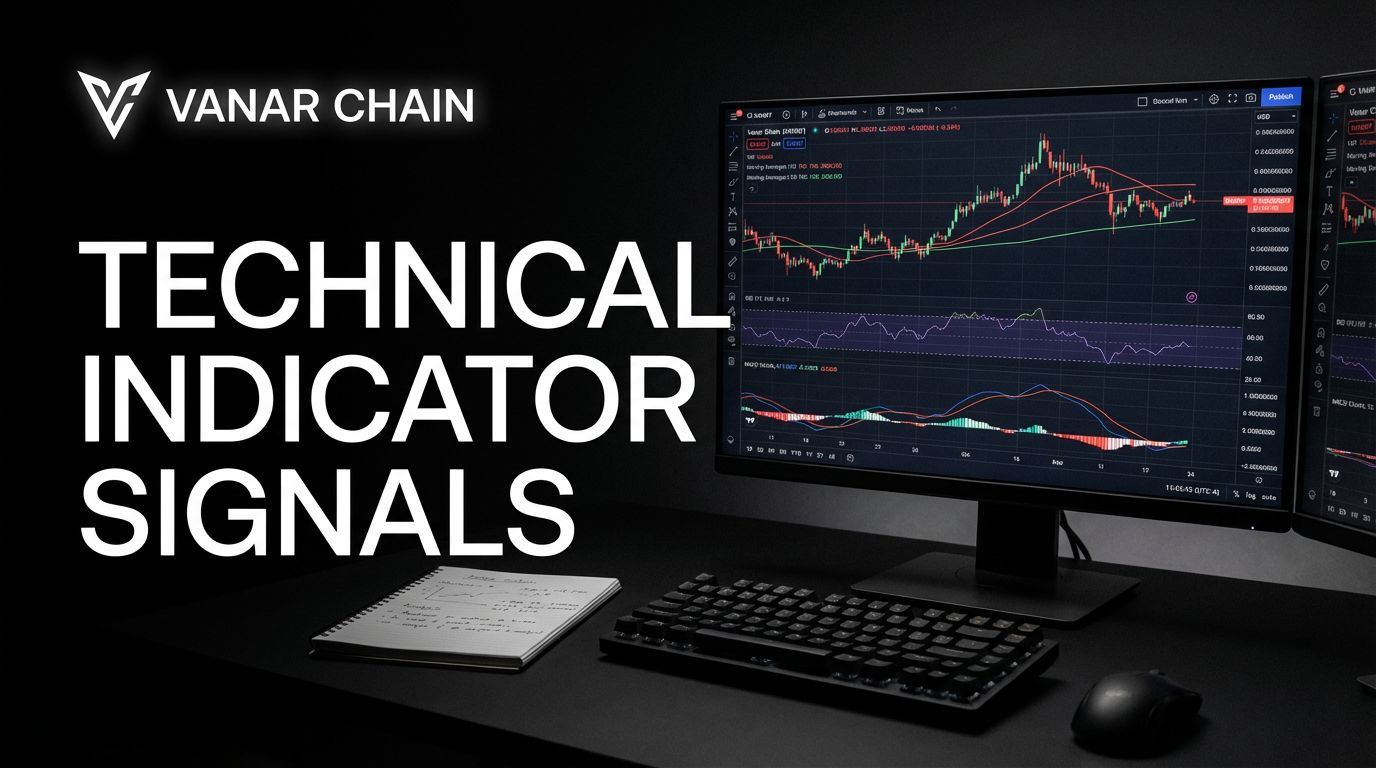
Some technical summaries show strong sell signals on major timeframes. Many oscillators and moving averages are signaling that bearish momentum is stronger than bullish momentum. This suggests sellers are currently dominating price action.
At the same time, certain sources show neutral or even buy signals on short moving averages and oscillators like RSI. This indicates some buying interest remains, but it is not strong enough to confidently declare a trend reversal yet.
Key Support and Resistance Levels
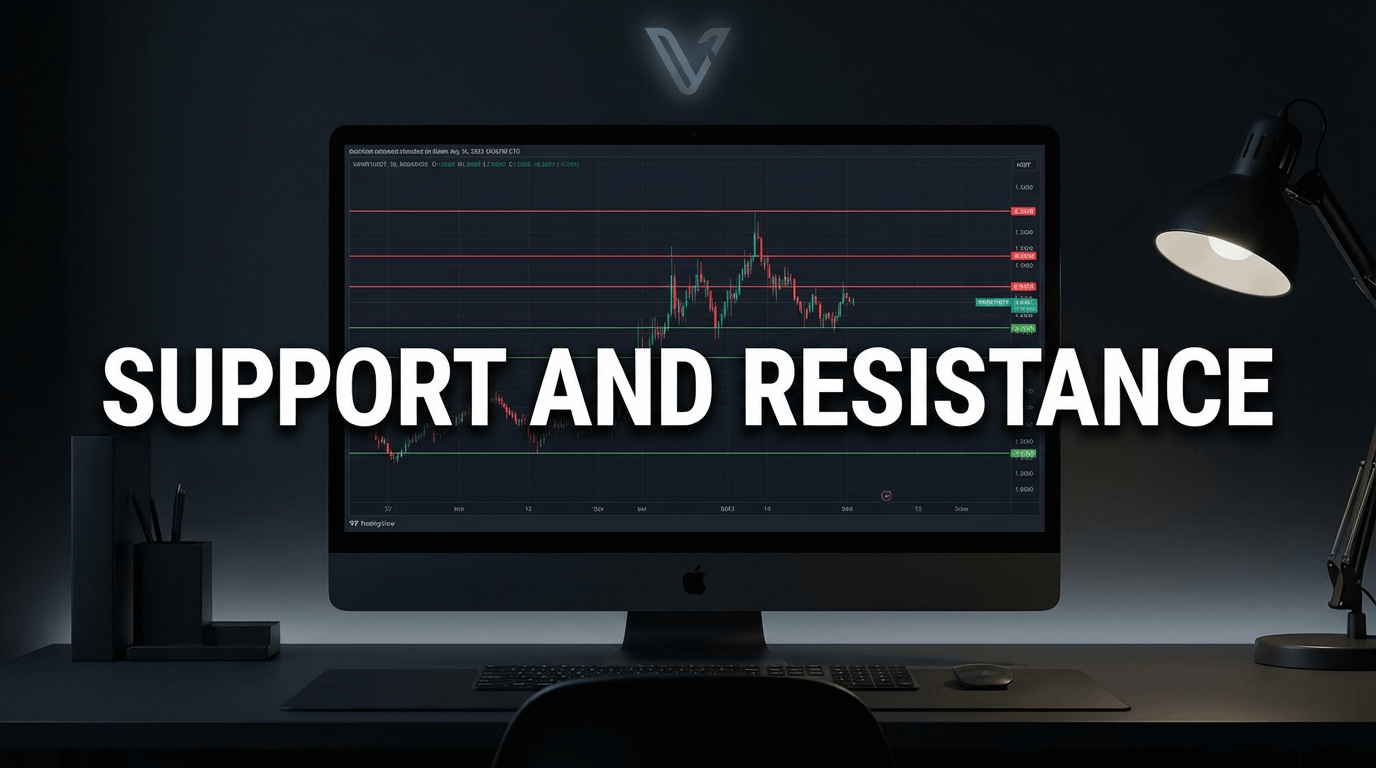
Support and resistance levels help identify where price is likely to find buying or selling pressure.
Important support levels identified from recent classical pivot analysis include values around 0.0061 USD, 0.0059 USD, and a stronger support near 0.0057 USD. These are areas where buyers might step in if price falls further.
Important resistance levels are located near 0.0065 USD, 0.0067 USD, and around 0.0069 USD. These levels represent price zones where selling pressure may increase and pull price back down if buyers fail to push higher.
Momentum and Strength Analysis

The Relative Strength Index (RSI) is often used to measure momentum. Current RSI values for VANRY are in a neutral zone. This means price is not strongly overbought or oversold, and trend strength is not clear. (Investing.com)
Moving averages show mixed signals. Shorter term average prices sometimes show slight buy signals, but medium to longer term averages lean toward sell signals. This again reflects market indecision for VANRY right now.
Market Structure
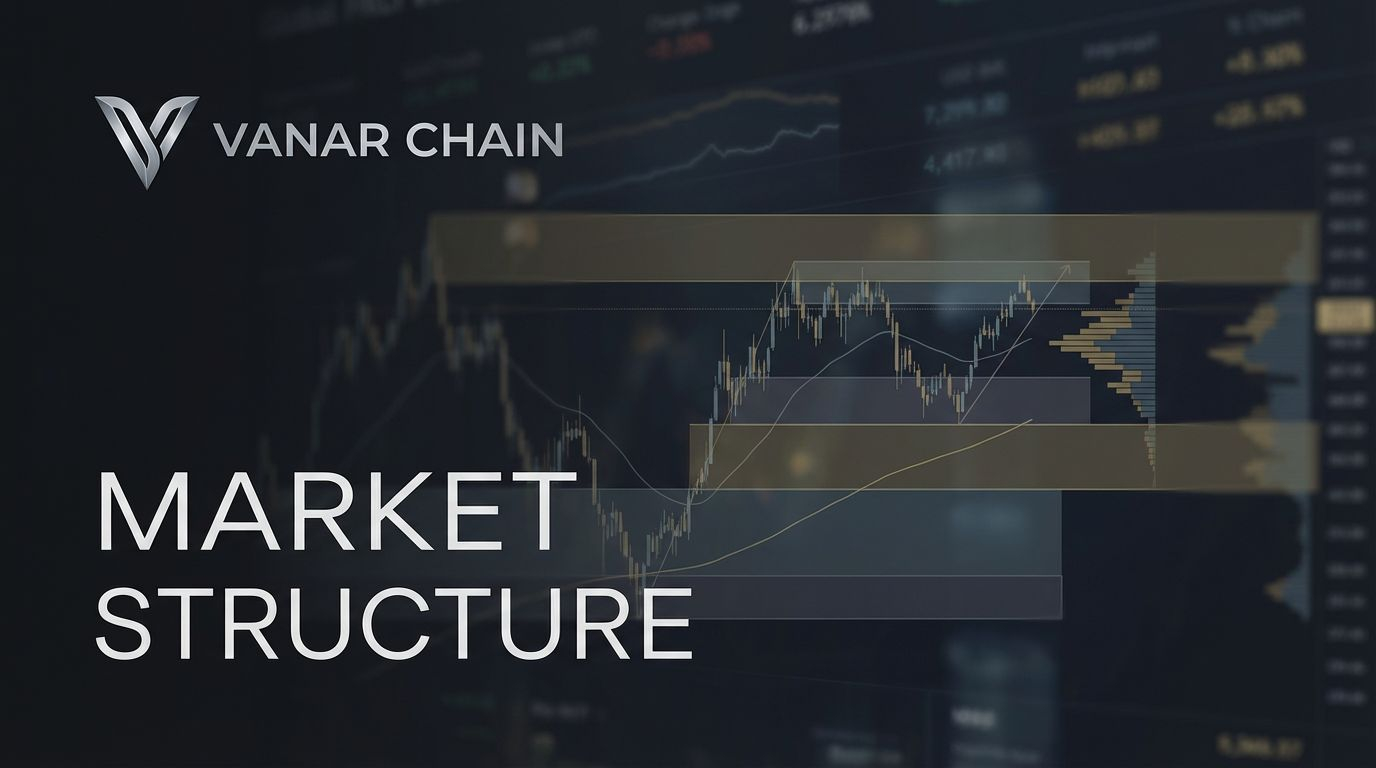
Vanar Chain is trading significantly below its historical peak price, and at levels that indicate a prolonged period of low momentum compared to previous cycles. Long-term holders might see this as a baseline area, while short-term traders may treat these levels as high-risk and uncertain. (CoinGecko)
Volume patterns and volatility also appear relatively low compared to major cryptocurrencies, which can make breakout movements harder to sustain without significant market catalysts.
What This Means for Traders

Price is in a neutral to bearish sentiment zone. Buyers are present but not strong enough to push price decisively upward. Sellers are currently more active according to most technical signals.
If price falls below the lower support zone around 0.0057 USD, this could trigger further declines in the near term. Conversely, if price breaks above the resistance area near 0.0067 to 0.0069 USD with good trading volume, this could start attracting more buying interest. (CoinCheckup)
Conclusion

@Vanarchain is currently in a phase where technical indicators give mixed messages. Bears seem stronger overall, but short-term momentum and some moving averages suggest there is still buying interest at higher levels. Traders should watch key support and resistance zones closely and look for clear confirmation before entering positions.
This analysis is based on chart readings and technical indicators from major crypto analysis platforms. It is educational in nature and not financial advice.