SUI vs. BTC Correlation Analysis (February 2026)
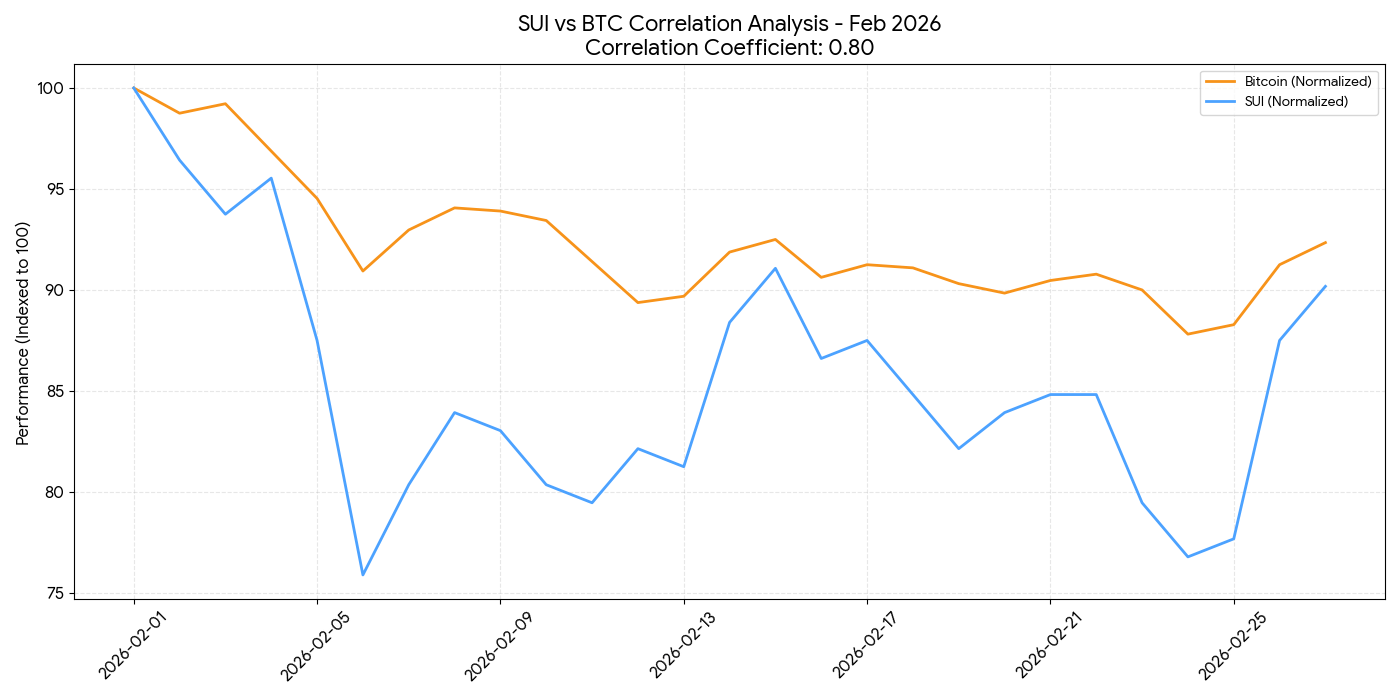
To understand if SUI is a "leader" or a "follower," we look at how its price moves relative to Bitcoin (BTC). For February 2026, the data reveals a correlation coefficient of 0.80, which signifies a strong positive relationship.
However, the "devil is in the details" of the recovery phase.
Key Insights
Shared Volatility, Different Strength: While both assets followed the same downward trajectory in early February, SUI's "V-bottom" on February 6th was much more aggressive than Bitcoin's. SUI dropped 24% vs. BTC's 9% in that same window, showing its higher beta (volatility).
The Decoupling Signal: Since February 24th, SUI has begun to outperform BTC on the recovery. While BTC rose roughly 5% from its weekly low, SUI surged 17%. This suggests that while SUI still follows the general market "weather" set by Bitcoin, its internal ecosystem news (like the ETP launches) is allowing it to recover value much faster.

Leading or Following? Currently, SUI is following the market direction but leading in terms of recovery percentage. It acts as a "high-torque" version of the market; when BTC stabilizes, SUI tends to sprint.
Performance Comparison Chart
The following chart normalizes both assets to a value of 100 on February 1st to show which asset has retained more value relative to its starting point.
What This Means for You
If BTC breaks $60k: Expect SUI to challenge its $1.15 resistance quickly, as it is currently showing higher relative strength.

If BTC stays sideways: SUI is likely to continue its independent climb toward $1.05 based on institutional inflows into its new ETPs.