The crypto market never sleeps, and Ethereum (ETH) continues to remain one of the most closely watched assets among traders. After a period of volatility, ETH is now approaching a crucial technical zone that could determine the next major move in the market.
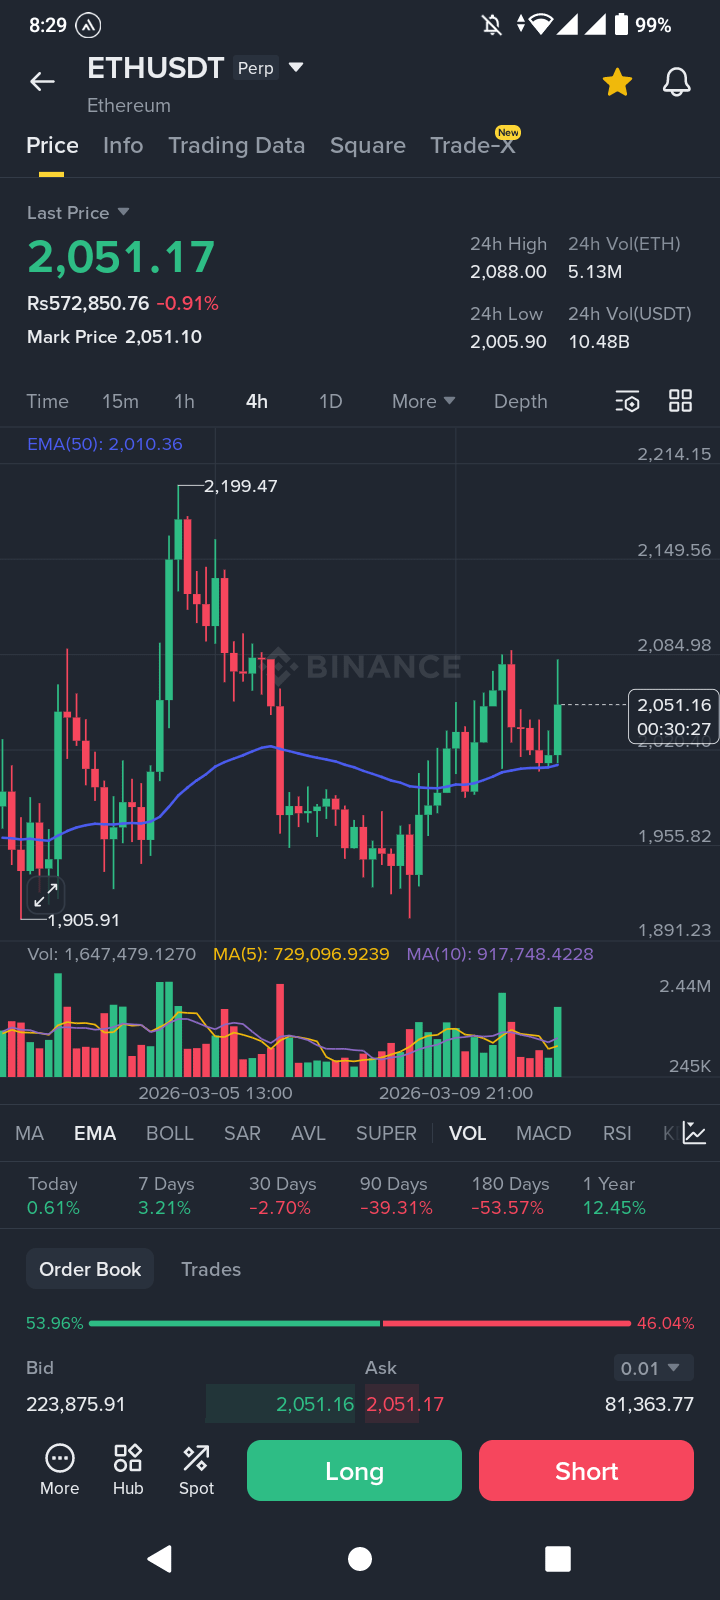
Currently, ETH is trading around $2,052, showing signs of stabilization after recent fluctuations. The key question traders are asking now is:
➤ Is Ethereum building momentum for another rally, or preparing for a deeper correction?
Let’s break down the technical structure, key levels, and potential price scenarios based on the current chart.
◆ Ethereum Technical Analysis (4H Timeframe)
✔︎ Current Market Structure
On the 4-hour chart, Ethereum is showing a gradual recovery after a previous bearish phase. The price recently bounced from the lower demand zone and is now attempting to reclaim higher levels.
Important observations:
➤ Price is currently above the MA(50) around $2,020, which is a bullish signal in the short term.
➤ The market structure shows higher lows forming, indicating growing buying pressure.
➤ Volume is increasing during upward candles, suggesting buyers are gradually gaining control.
This combination often signals accumulation before a breakout.
◆ Key Support and Resistance Levels
① Major Support Zone
✔︎ $2,000 – $2,020
This zone aligns with the 50-period moving average, which is acting as dynamic support. As long as ETH remains above this area, the bullish structure remains intact.
② Immediate Resistance
✔︎ $2,065 – $2,090
Price recently tested this region and faced rejection. A clean breakout above this level could trigger the next upward momentum.
③ Strong Resistance
✔︎ $2,150 – $2,200
This area previously acted as a supply zone and could become the next major target for bulls.
◆ Indicator Signals
✔︎ RSI (Relative Strength Index)
➤ RSI is currently around 63, indicating healthy bullish momentum but not yet in the overbought zone.
➤ This suggests there is still room for upside movement.
✔︎ MACD
➤ The MACD line is above the signal line, showing bullish momentum building.
➤ If the histogram continues expanding, it could confirm further upside continuation.
✔︎ Volume Analysis
➤ Recent bullish candles are supported by rising volume, which is a strong confirmation of buyer interest.
➤ Increasing volume near resistance usually precedes a breakout attempt.
◆ ETH Price Prediction Scenarios
Bullish Scenario
If ETH successfully breaks $2,065 resistance, the next targets could be:
➜ $2,100
➜ $2,150
➜ $2,200
A strong breakout above $2,200 could open the door for a larger rally.
Bearish Scenario
If ETH fails to hold above $2,020 support, the price may revisit lower zones:
➜ $1,980
➜ $1,950
➜ $1,900 demand zone
This area previously triggered strong buying interest.
◆ What Traders Should Watch Next
Professional traders are closely monitoring three key signals:
✔︎ Breakout above $2,065 resistance
✔︎ Support holding above $2,020
✔︎ Volume expansion during upward moves
If these conditions align, Ethereum could be preparing for another impulsive move upward.
Ethereum is currently sitting at a decision point. The price structure suggests growing bullish pressure, but resistance levels must still be broken to confirm a sustained rally.
➤ Above $2,065 → bullish momentum may accelerate
➤ Below $2,020 → short-term correction possible
In crypto markets, patience and confirmation are key.
✔︎ Do you think ETH will break $2,100 soon or face another rejection?
◆ Share your thoughts in the comments
◆ If you found this analysis helpful, like and share it with fellow traders

#BinanceTGEUP #IranianPresident'sSonSaysNewSupremeLeaderSafe #UseAIforCryptoTrading #TrumpSaysIranWarWillEndVerySoon #OilPricesSlide