The crypto market continues to move in waves of momentum and hesitation, and XRP is currently sitting at a critical technical level. After recovering from recent lows, XRP is now trading around $1.40, showing signs of renewed bullish pressure while still facing strong resistance overhead.
For traders and investors, this zone is extremely important because it could determine whether XRP enters another bullish leg — or falls back into consolidation.
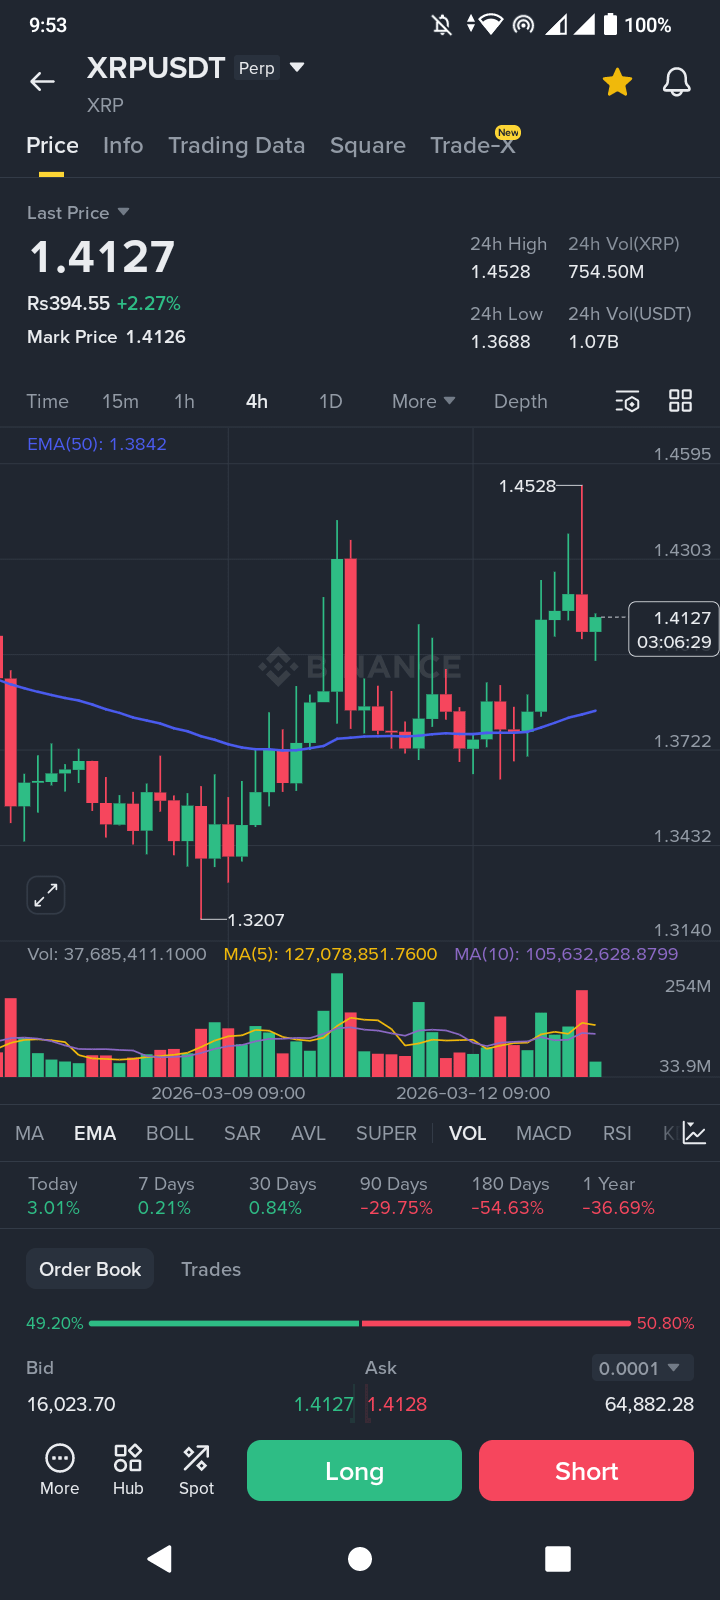
Let’s break down the technical structure, indicators, and key levels based on the latest 4-hour chart.
➤ Current Market Overview
✔ Current Price: $1.4089
✔ 24H High: $1.4524
✔ 24H Low: $1.3686
✔ Key Moving Average (MA50): $1.3779
The market structure shows that XRP has recently reclaimed the 50-period moving average, which often acts as a short-term trend indicator. When price holds above this level, it usually signals bullish momentum building underneath the market.
◆ Technical Analysis (4H Chart Breakdown)
① Support Structure Is Strengthening
A strong base formed around $1.32, where buyers aggressively stepped in. This level now acts as major structural support.
Key support zones:
➜ $1.37 – $1.38 → Dynamic support near MA50
➜ $1.32 → Strong demand zone and recent swing low
As long as price remains above $1.37, the short-term bullish structure remains intact.
② Resistance Zone Near $1.45
The chart clearly shows rejection near $1.45 – $1.47, where sellers previously stepped in.
Important resistance levels:
◆ $1.45 → Immediate resistance
◆ $1.47 → Recent swing high
◆ $1.50 → Psychological breakout level
If XRP successfully breaks $1.45, the market could quickly target $1.50 and higher due to relatively thin resistance above.
③ RSI Indicates Controlled Bullish Momentum
The Relative Strength Index (RSI) is currently hovering between 55 – 62, which signals:
✔ Momentum is bullish but not overbought
✔ Buyers still have room to push the price higher
✔ No immediate exhaustion signals
This type of RSI structure often appears before continuation moves.
④ MACD Shows Early Bullish Expansion
The MACD indicator is turning positive with the DIF line crossing above the signal line, suggesting:
➤ Increasing bullish momentum
➤ Buyers gradually gaining control
➤ Potential continuation toward resistance
When MACD flips positive after consolidation, it often precedes momentum breakouts.
◆ Volume Behavior
Volume has started to increase during upward moves, which is a healthy sign.
✔ Buyers are supporting the price
✔ Breakouts could be stronger if volume continues rising
However, traders should watch for volume spikes near $1.45, as this will determine whether the breakout is real or a fakeout.
➜ XRP Possible Scenarios
Bullish Scenario
If price holds above $1.37 and breaks $1.45, the next targets could be:
① $1.47
② $1.50
③ $1.55 – $1.60
Momentum traders will likely enter once $1.45 resistance flips into support.
Bearish Scenario
If XRP fails to hold above MA50 ($1.37), the price could retest lower support levels:
➜ $1.35
➜ $1.32 demand zone
A break below $1.32 would weaken the current bullish structure.
◆ Final Thoughts
Right now, XRP is at a decision point. The technical indicators suggest growing bullish momentum, but the market still needs a clean breakout above $1.45 to confirm the next rally.
Until then, the price may continue consolidating between $1.37 and $1.45 as traders accumulate positions.
Smart traders understand that the biggest moves often come after periods of tight consolidation.
✔ Key Levels to Watch
➤ Support: $1.37 | $1.32
➤ Resistance: $1.45 | $1.47 | $1.50
➜ What Do You Think?
Do you believe XRP will break above $1.45 and start a new rally, or will the market reject again?
◆ Drop your thoughts in the comments
◆ Share this analysis with fellow traders
◆ Follow for more professional crypto market insights

#BTCReclaims70k #PCEMarketWatch #AaveSwapIncident #BinanceTGEUP