📊 Fundamental Analysis
Sentiment around Ethereum is stabilizing as price holds near $2,098 after a prolonged decline. 📈
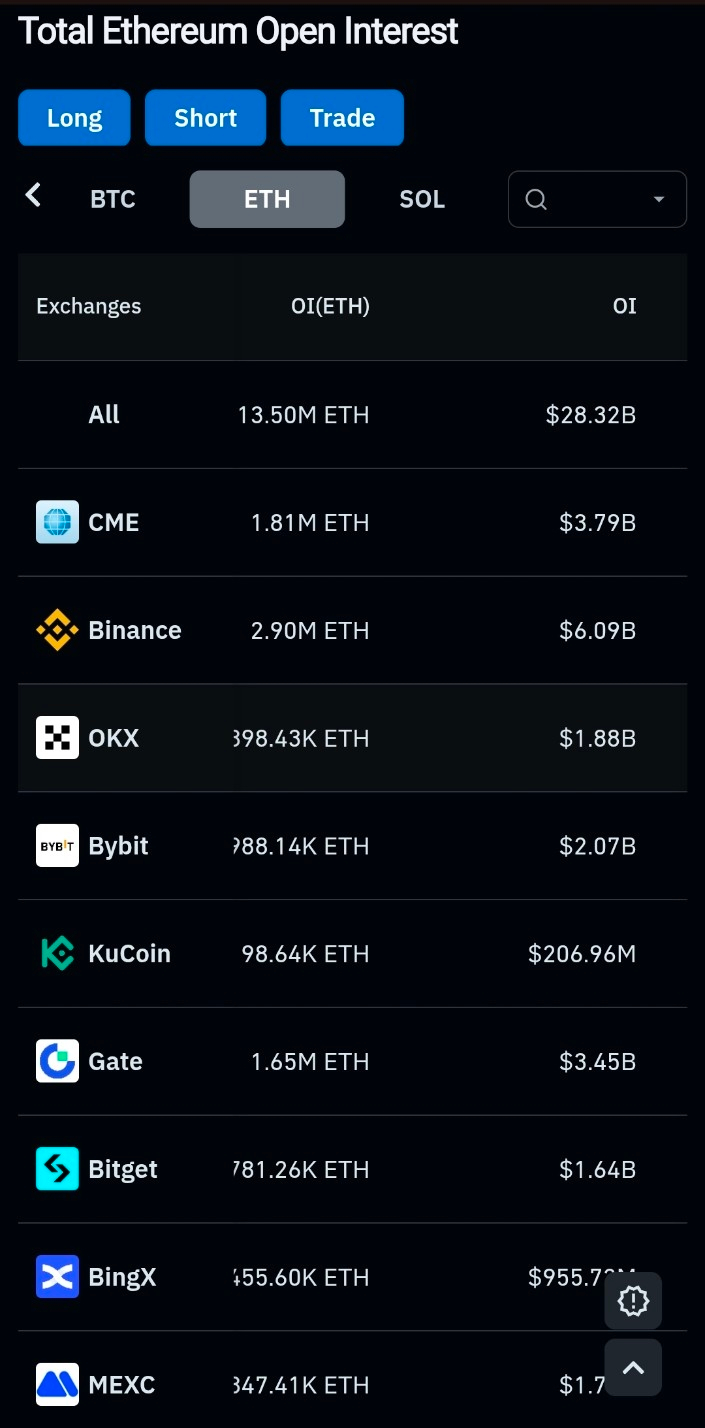
Derivatives markets show $28.3B), indicating heavy leveraged participation. 💰
Institutional activity is visible through strong positioning on the Chicago Mercantile Exchange, where open interest is about 1.81M ETH (~$3.79B).
Large holders are accumulating aggressively, suggesting smart money positioning during the consolidation phase. 🔥
📊 24H Market Information
Trading volume remains moderate with about $1.08B activity on Binance. 💱
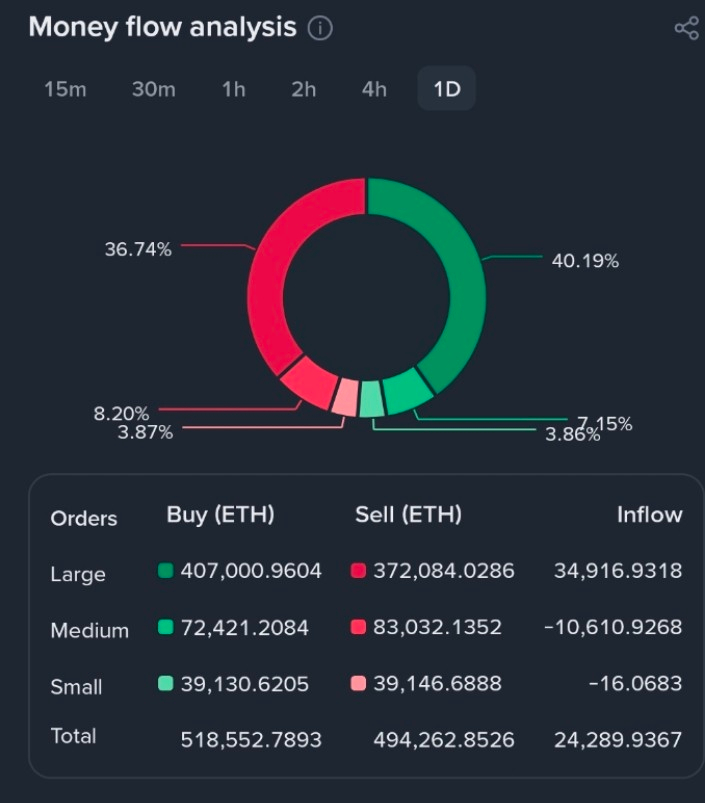
Order flow shows +24,289 ETH net inflow, driven mainly by large buyers.
Whale purchases total roughly 407K ETH vs 372K ETH sold, creating a strong +34.9K ETH net accumulation. 💰
Retail and medium traders appear to be distributing supply while large players absorb liquidity.
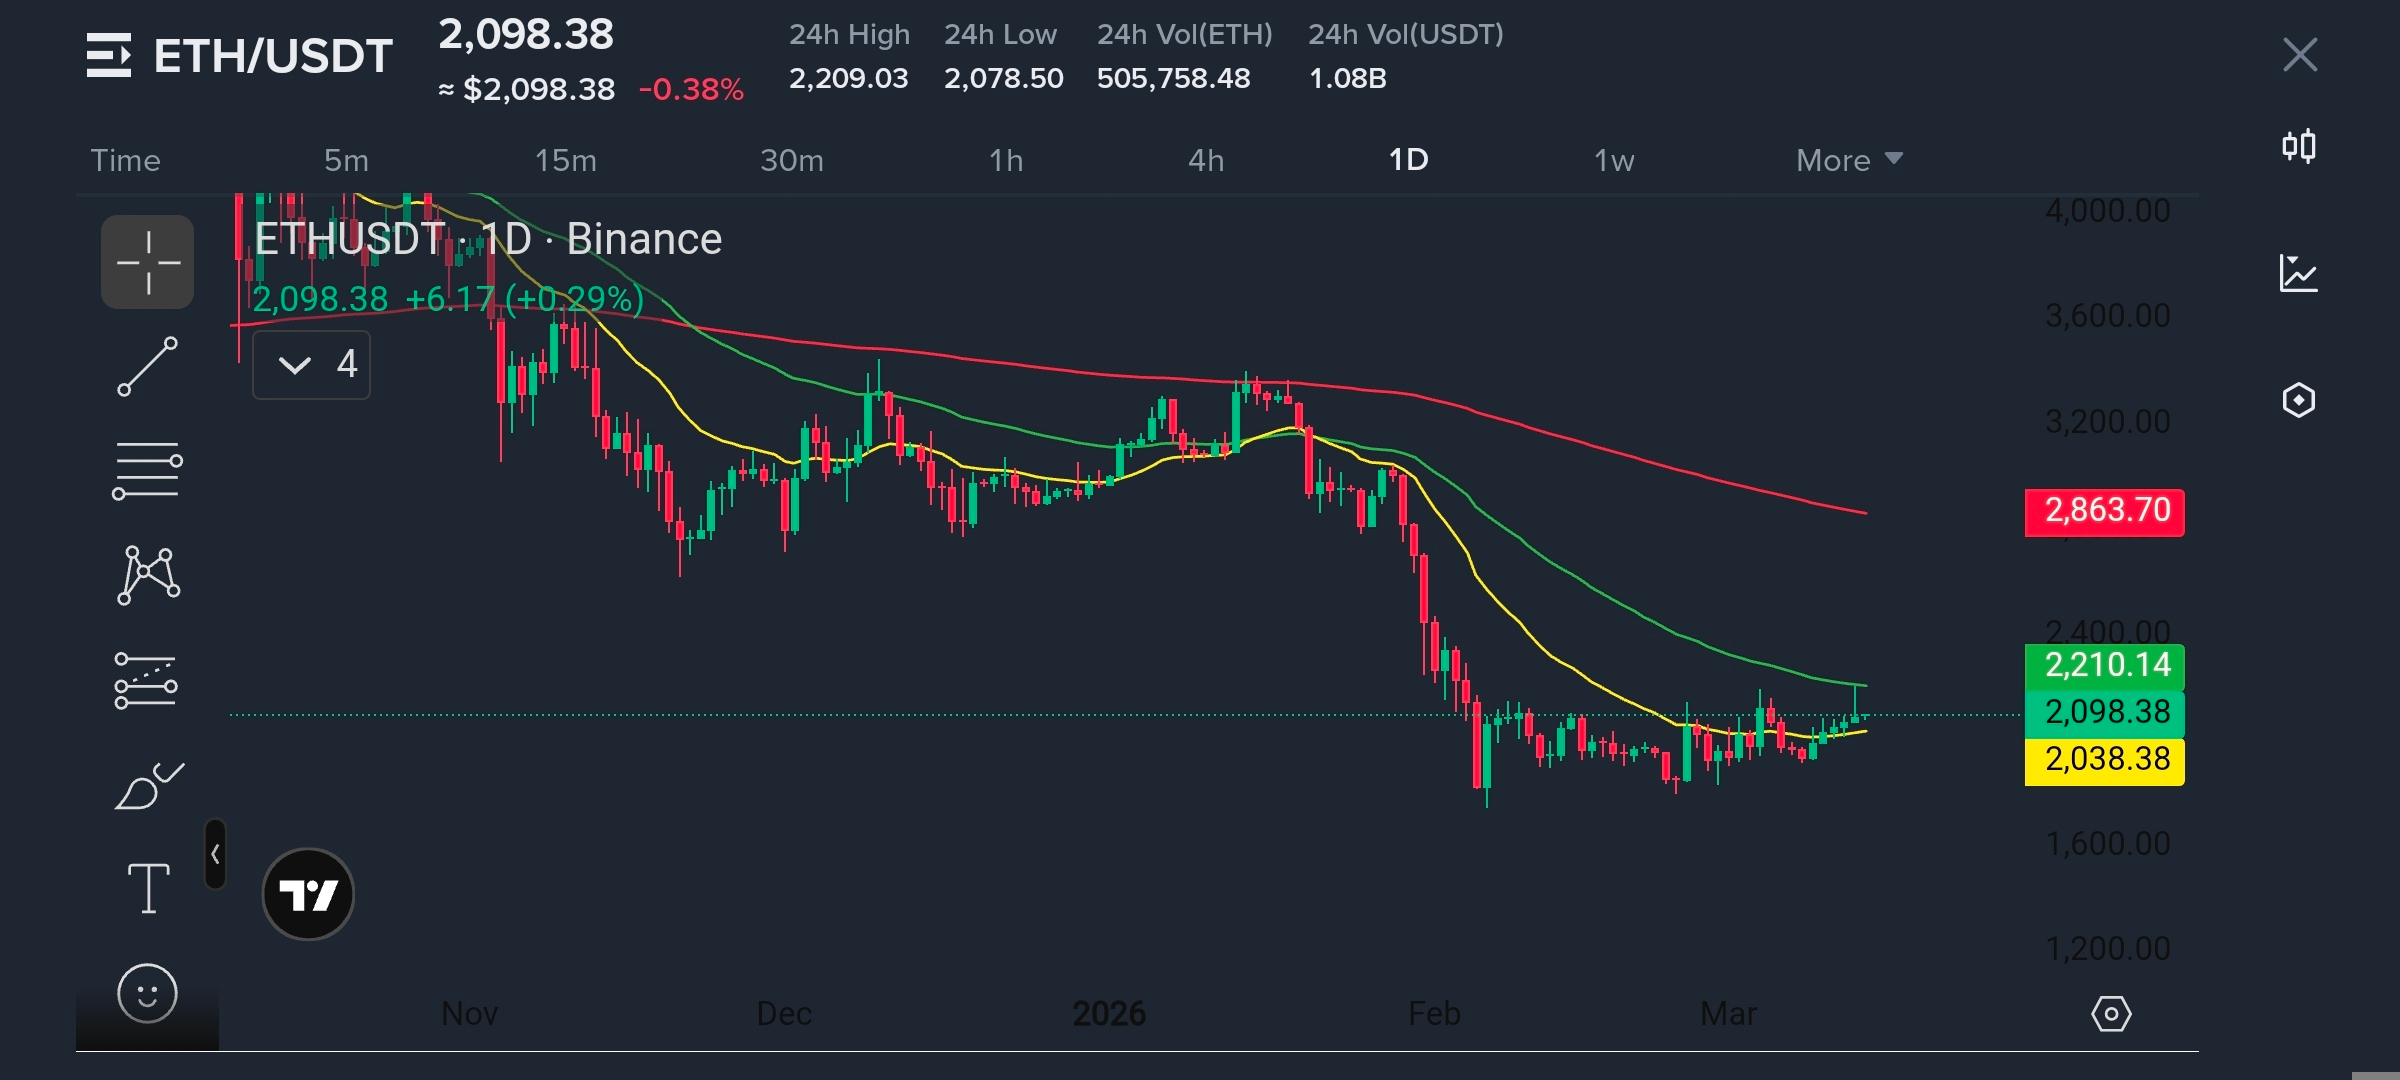
📊 1 Day Technical Analysis
The 1D structure shows Ethereum attempting to stabilize above the $2,000 psychological level. 📉
Price is building a potential accumulation base, similar to the broader market recovery pattern. 💰
Critical resistance is located near $2,210, where previous rallies have stalled.
A confirmed breakout above this zone would open breakout potential 🚀 toward $2,240+.
Major support remains near $1,980, serving as the structural demand floor.
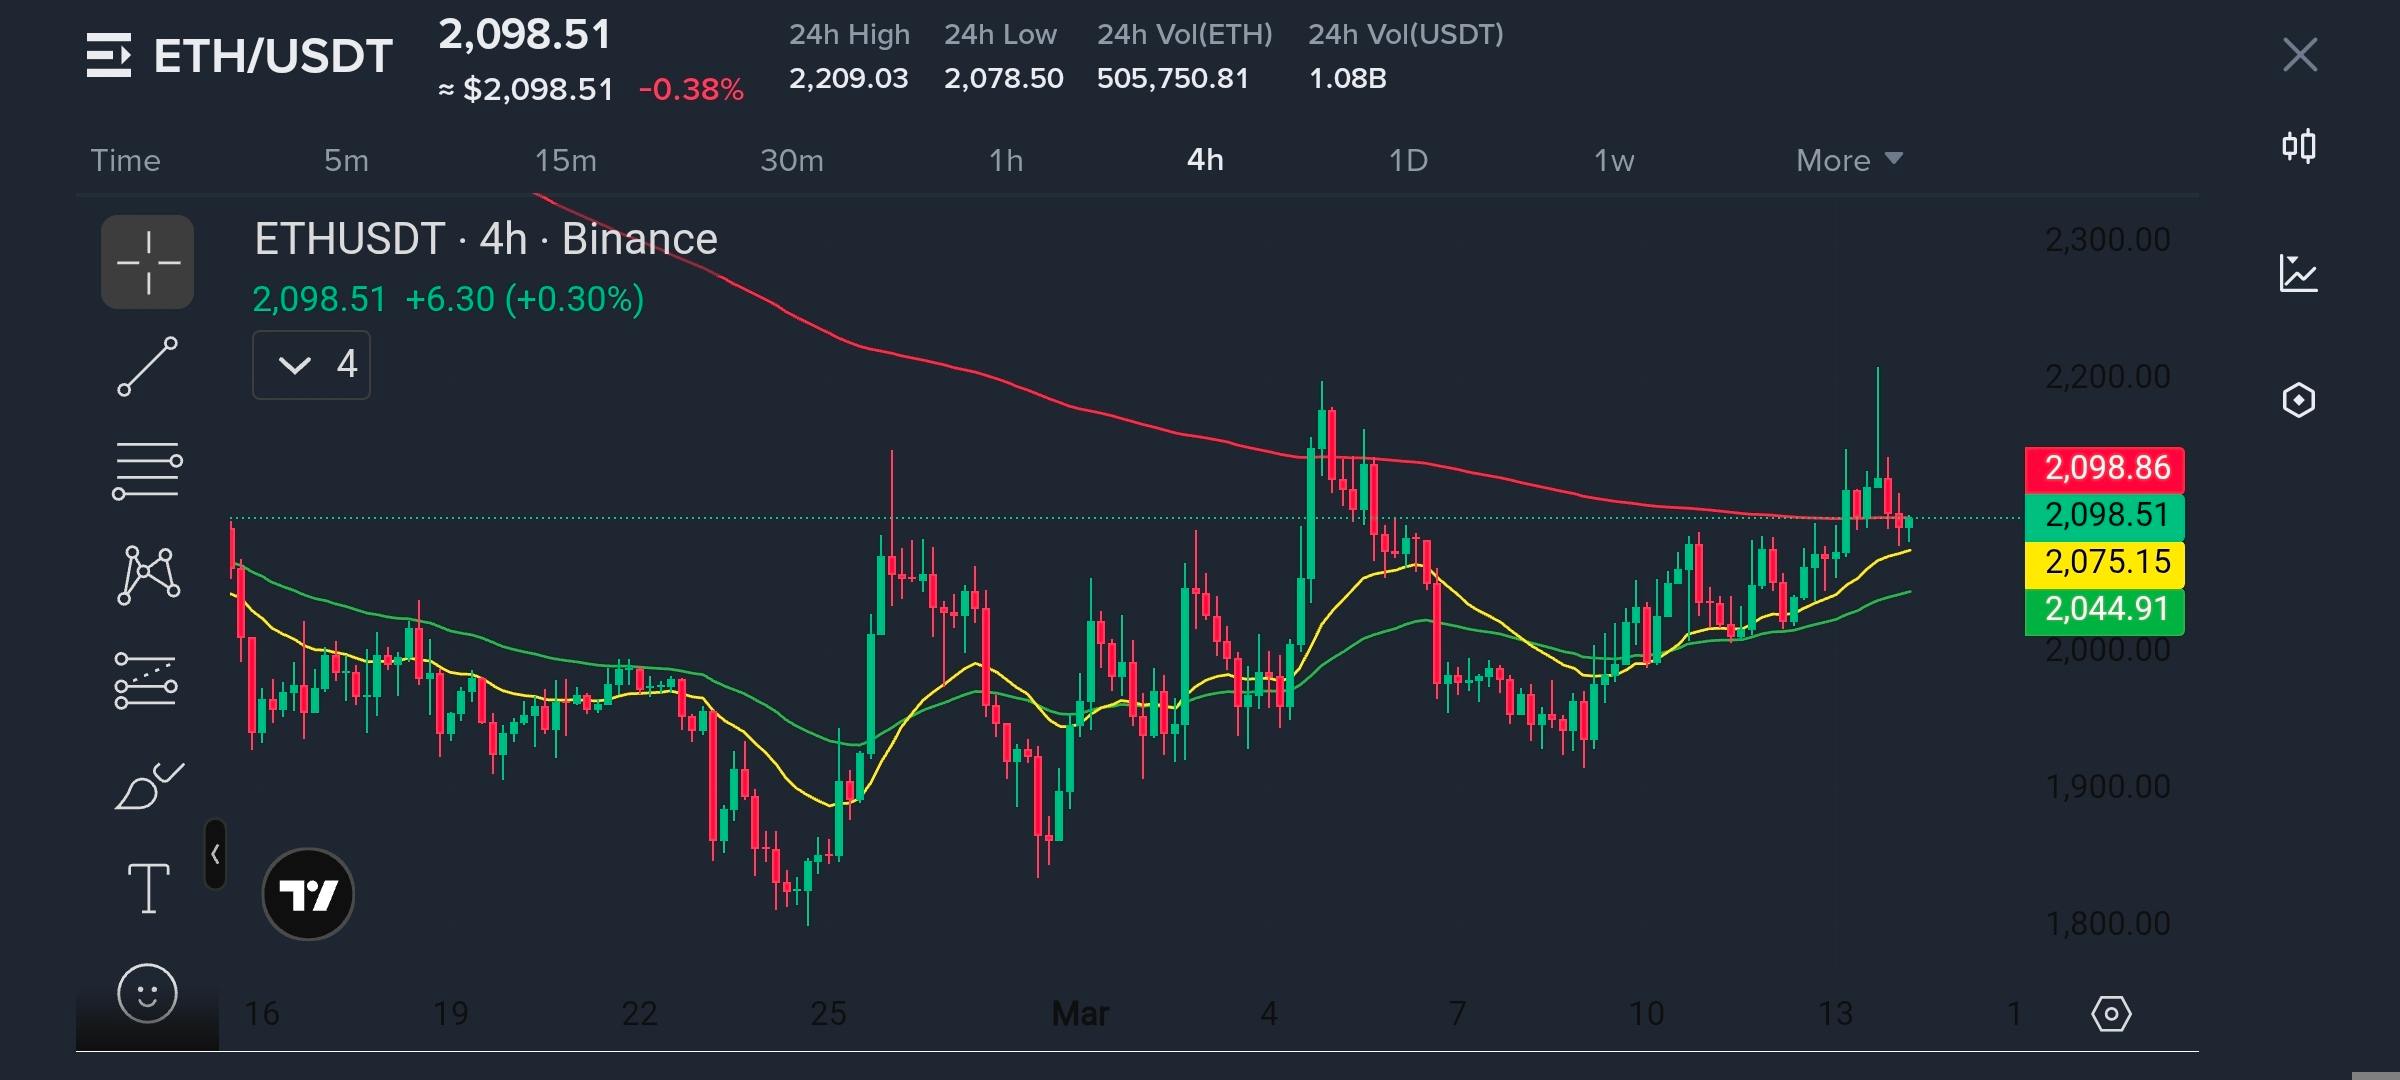
📊 4 Hour Technical Analysis
The 4H trend shows an early recovery phase with price holding above recent lows. 📈
Support is positioned around $2,044, where buyers previously defended the structure.
Resistance sits near $2,125, forming the next barrier before a liquidity sweep.
Price hugging fast EMAs suggests gradual bullish pressure building.
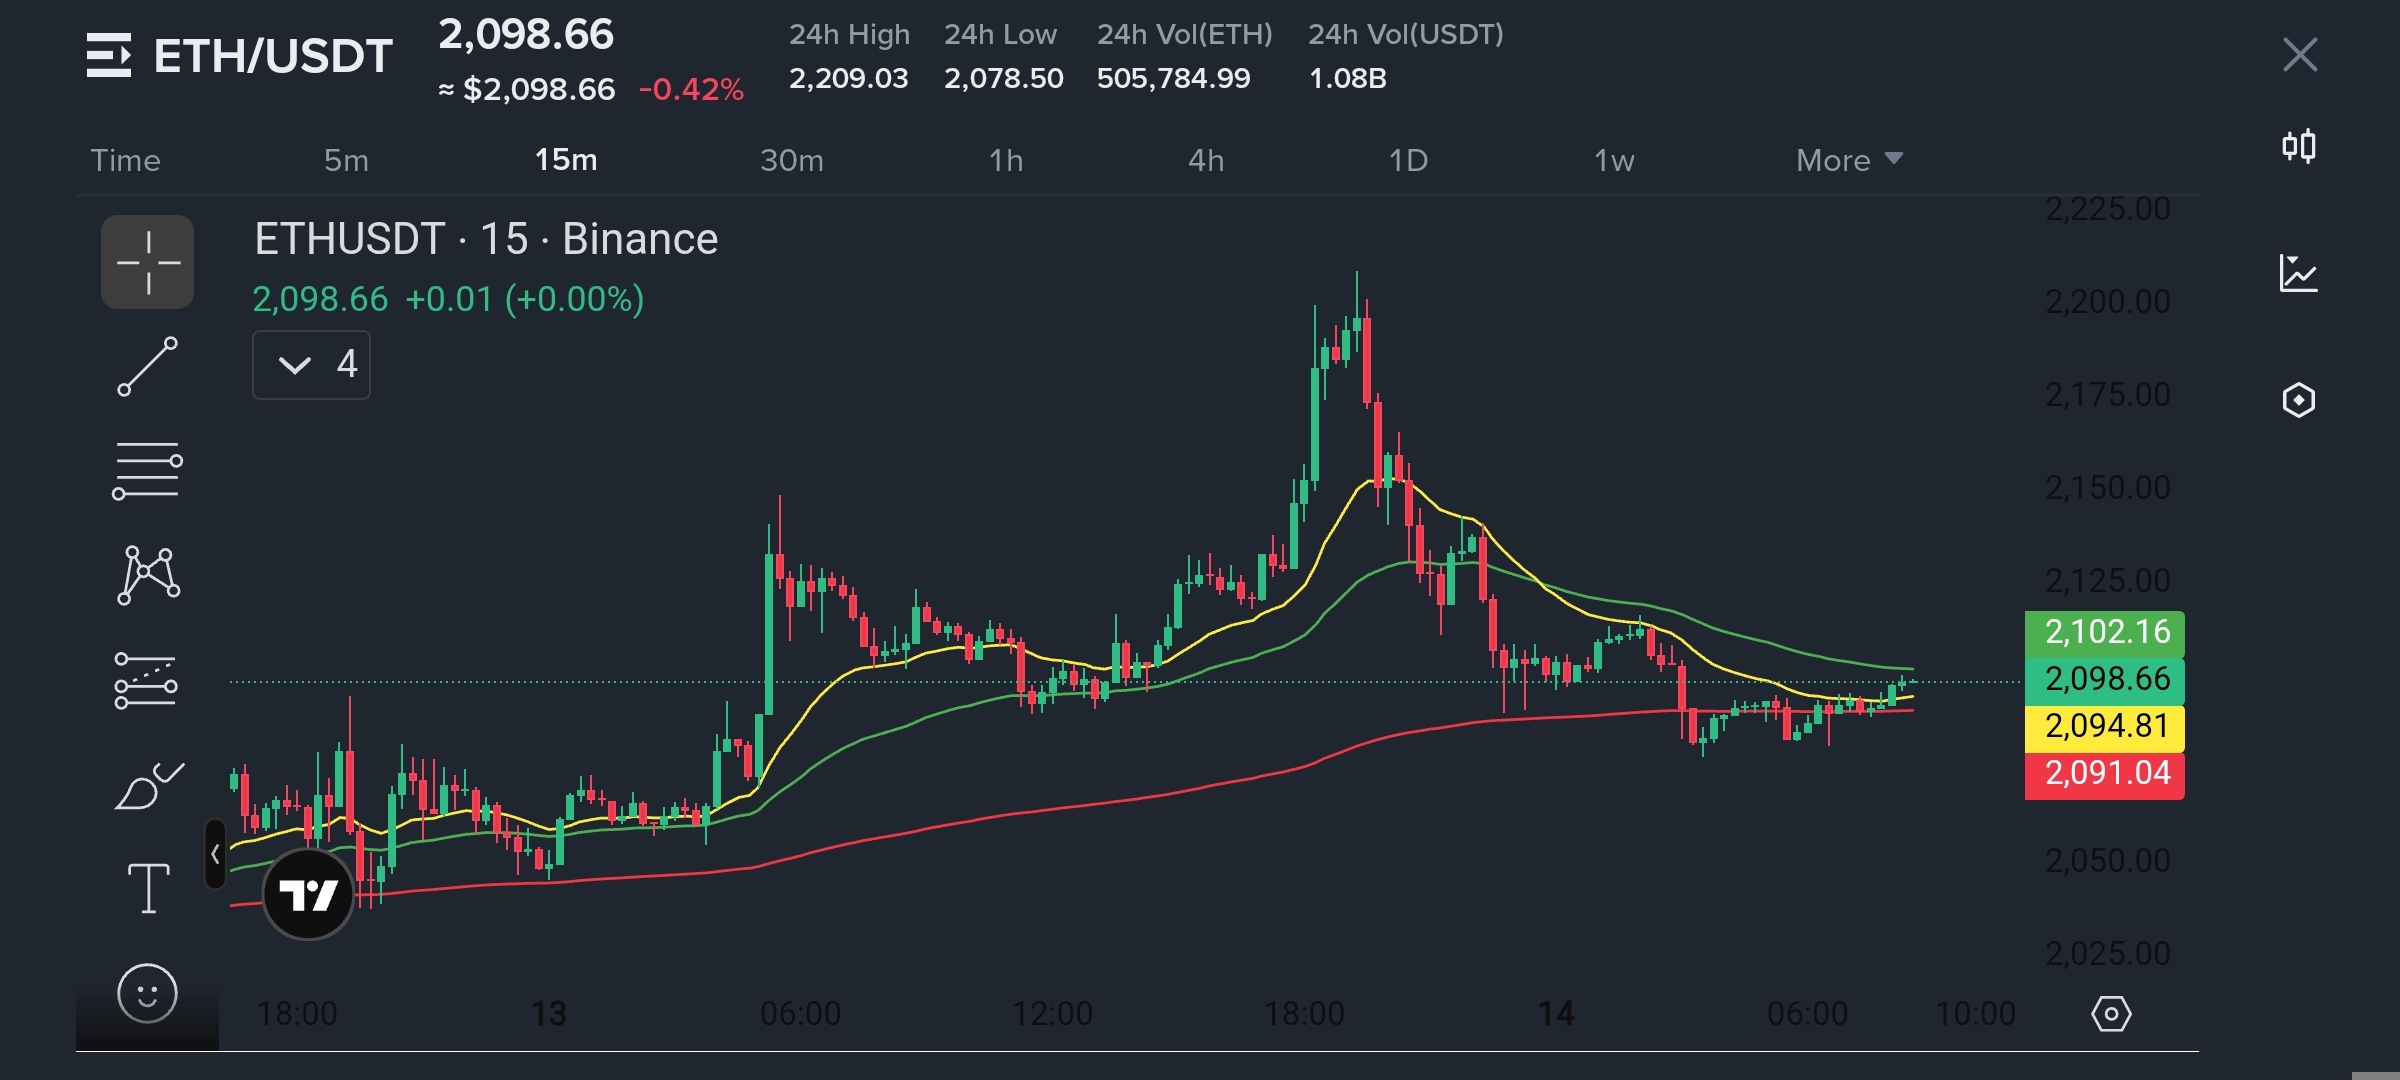
📊 15 Minute Technical Analysis
Micro structure remains neutral to slightly bearish after the rejection from $2,190. 📉
Price trades slightly below the 15M EMA cluster near $2,102, indicating short-term selling pressure.
Immediate support sits near $2,091, while resistance appears at $2,110. 💱
This consolidation typically precedes a volatility expansion.
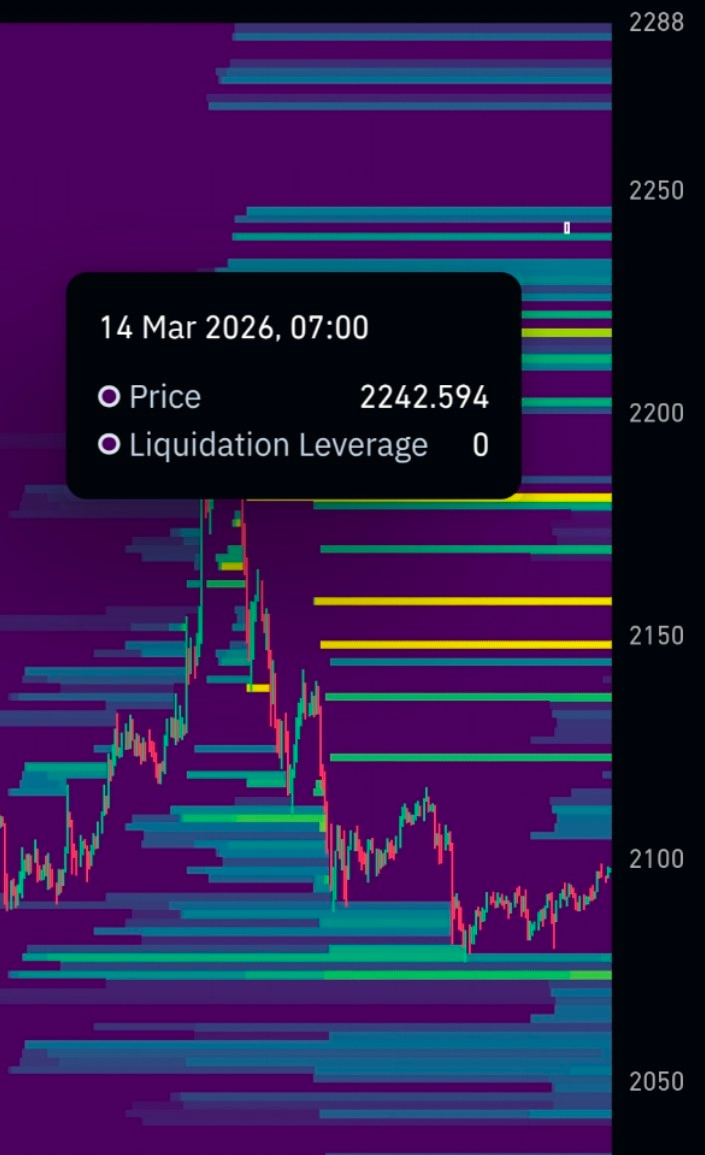
📊 Liquidity & Smart Money
Liquidity positioning 💰 reveals large clusters above and below the current price.
Upside Liquidity (Short Liquidations)
• $2,150 – $2,180
Downside Liquidity (Long Liquidations)
• $2,040 – $2,050
A larger leverage target is located near $2,242, making the $2,180 region a likely liquidity magnet.
📊 Derivatives Positioning
Total open interest stands at $28.3B).
Major exchange distribution:
• Binance: $6.09B)
• CME: $3.79B)
• Gate.io: $3.45B)
• Bybit: $2.07B)
High open interest means any breakout could trigger significant liquidation-driven volatility.
📊 Most Likely Liquidity Paths
Scenario A (60%)
Move toward $2,150 – $2,180
Short liquidations triggered
Possible pullback afterward
Scenario B (30%)
Breakdown toward $2,040
Flush long positions before recovery
Scenario C (10%)
Break above $2,210
Target $2,240+ 🚀
📊 High Probability Trading Zones
Long Zone 💱
$2,045 – $2,060
Short Zone 💱
$2,180 – $2,200
Invalidation
Daily close below $1,950
📊 Final Bias
Directional Bias: Neutral → Bullish 📈
Best Approach: Liquidity Sweep Strategy 💱
Ethereum appears to be in a smart-money accumulation phase, with whales absorbing supply near $2,000–$2,100, making a liquidity run toward $2,180 the most probable near-term move.