What is Volume?
Volume shows how many coins exchanged hands in a specific time. If 1-minute candle shows 2.05K, it means 2,000 coins were bought and sold. Simple!
Price-Derived vs Counting Indicators
Price Indicators: Moving Averages, Bollinger Bands, RSI, ATR - these all come from price
Counting Indicators: Volume, Open Interest, Liquidations - these count actual market activity.
Important: Red/Green Volume Bars Mean NOTHING! 🚨
Don't get fooled by colors. Volume bars show total activity - both buyers AND sellers. The color is just for looks!
Large Volume ≠ Large Candle
Sometimes huge volume creates small candles. Why? Because big limit orders absorb the buying/selling pressure. Price doesn't move much, but activity is massive!
Mean Reversion vs Momentum
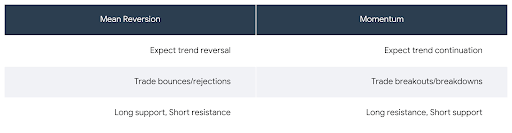
Best Volume for Each Strategy:
Mean Reversion: Flat volume or clearly decreasing volume
Momentum: Clearly increasing volume (strong trend confirmation)
Volume Spike + Price Spike = PAY ATTENTION!
When both volume and price explode together, something big is happening. This is where smart money moves!
Pro Tip: Use VOL/USD Indicator
Search volusd on TradingView to see volume in dollar terms. Much clearer than coin count!
Key Takeaway: Volume confirms everything. No volume = fake move. High volume = real move. Always check volume before entering any trade! 💡
What's your favorite volume strategy? Comment below! 👇