The Market Is Testing Traders Again…
Ethereum (ETH) is currently sitting at a critical psychological and technical zone near $2,100, and the market is sending mixed signals.
✔︎ After a strong rally toward $2,385, ETH faced a sharp rejection
✔︎ Sellers stepped in aggressively, pushing price back below key moving averages
✔︎ Indicators now suggest either a rebound setup… or a deeper correction
➤ The big question:
Is this a dip to buy — or the start of another bearish leg?
Let’s break it down like a pro trader
① 1D Timeframe Analysis (Macro View)
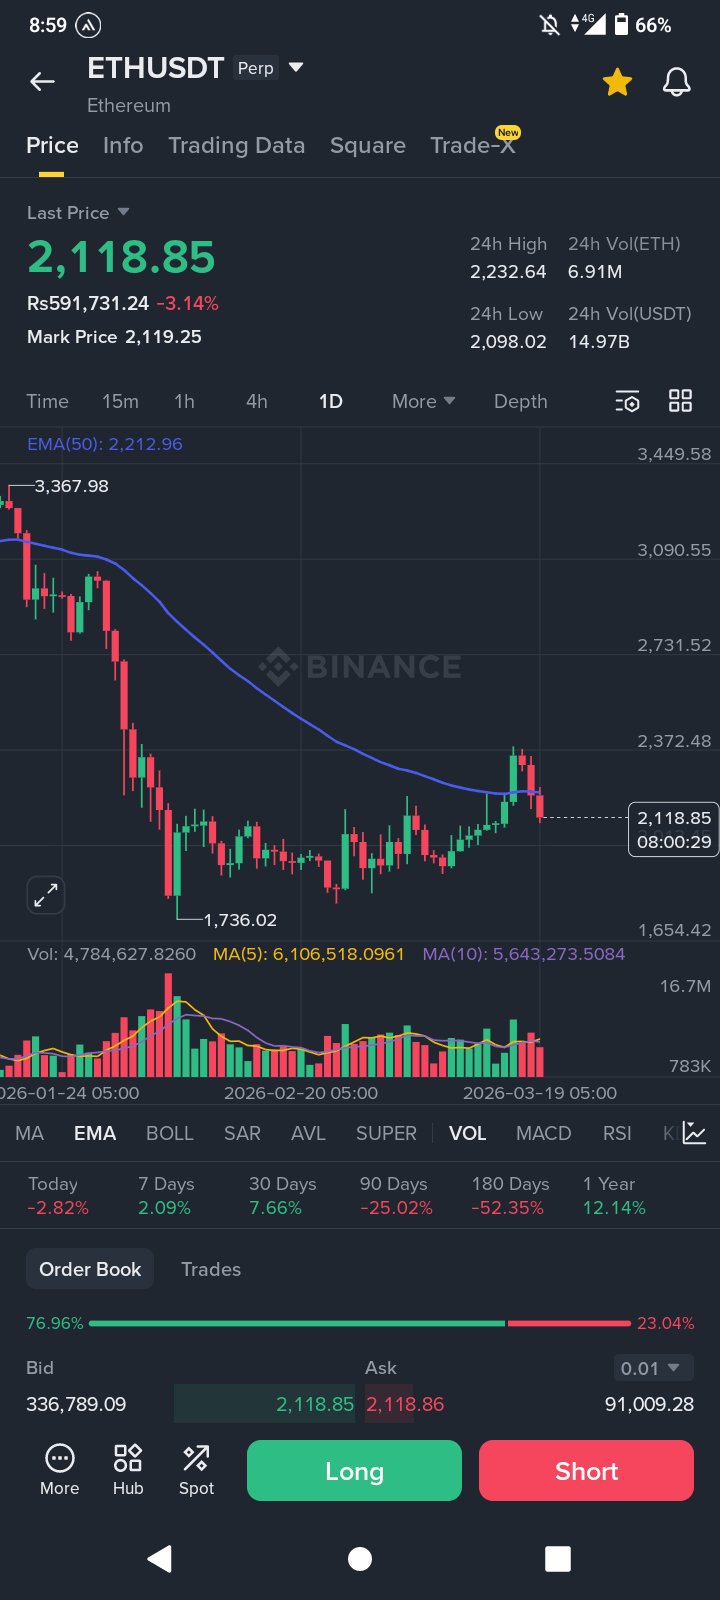
Trend Overview
◆ ETH is still in a macro downtrend (lower highs from $3,400 area)
◆ Recent bounce from $1,737 → $2,385 formed a temporary bullish structure
◆ Now facing rejection near MA(50) (~$2,080–$2,100 zone)
Key Indicators
✔︎ Moving Average (MA50)
➤ Price is struggling around MA(50)
➤ This level is acting as dynamic resistance
If ETH fails to hold above it → bearish continuation likely
✔︎ RSI (Daily)
◆ RSI around 45–50 zone
◆ No strong momentum yet
➤ Indicates neutral → slight bearish bias
✔︎ MACD
◆ Bullish momentum is fading
◆ Histogram weakening
➤ Suggests trend exhaustion after recent bounce
Key Levels (1D)
➤ Resistance Zones:
$2,200 – $2,250
$2,380 (major rejection zone)
➤ Support Zones:
$2,080 (critical MA level)
$1,950
$1,737 (strong demand zone)
1D Prediction
✔︎ Bullish Scenario:
➤ Break & hold above $2,200 → move toward $2,380
✔︎ Bearish Scenario (more likely currently):
➤ Lose $2,080 → drop toward $1,950 – $1,800
② 4H Timeframe Analysis (Short-Term Setup)
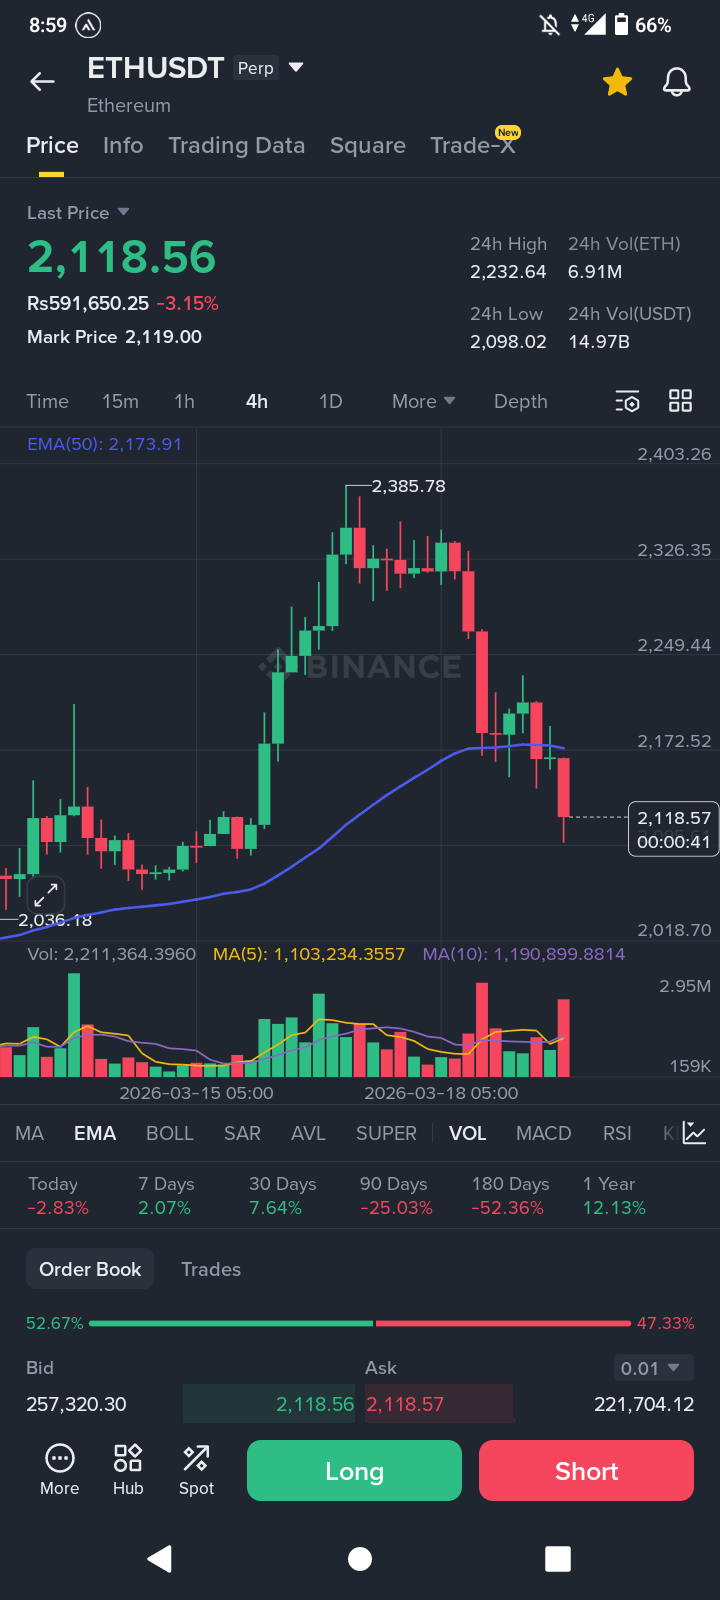
Market Structure
◆ Clear lower highs + lower lows forming
◆ Indicates short-term downtrend
Indicators Breakdown
✔︎ RSI (4H)
➤ RSI near oversold (16–30 zone)
Short-term bounce possible, but not trend reversal yet
✔︎ MACD
◆ Bearish crossover confirmed
◆ Strong downside momentum
✔︎ Volume
◆ Increasing selling volume during drop
➤ Confirms seller dominance
Key Levels (4H)
➤ Immediate Resistance:
$2,150 – $2,180
➤ Immediate Support:
$2,080
$2,020
4H Prediction
✔︎ Short-Term Bounce:
➤ Relief bounce toward $2,150–$2,180
✔︎ Continuation Dump:
➤ Break below $2,080 → quick move to $2,000 / $1,950
③ Smart Money Insight
✔︎ Recent news shows whale accumulation, but…
➤ Price still dropping → indicates distribution or trap phase
◆ This is where retail gets confused
◆ Smart money waits for confirmation, not emotions
Final Verdict: What Should Traders Do?
✔︎ Market is currently:
➤ Short-term bearish
➤ Mid-term neutral
Best Strategy Right Now
① Avoid chasing longs here
② Wait for confirmation above $2,200
③ Or look for breakdown trades below $2,080
Discipline Over Prediction
Ethereum is at a decision zone, and this is where most traders lose — not because of bad analysis, but because of impatience.
✔︎ The market rewards those who wait
✔︎ Not those who guess
What Do You Think?
➤ Will ETH bounce from here or break down further?
➤ Are you bullish or bearish at $2,100?
Drop your opinion in the comments & share this analysis with your trading circle!
