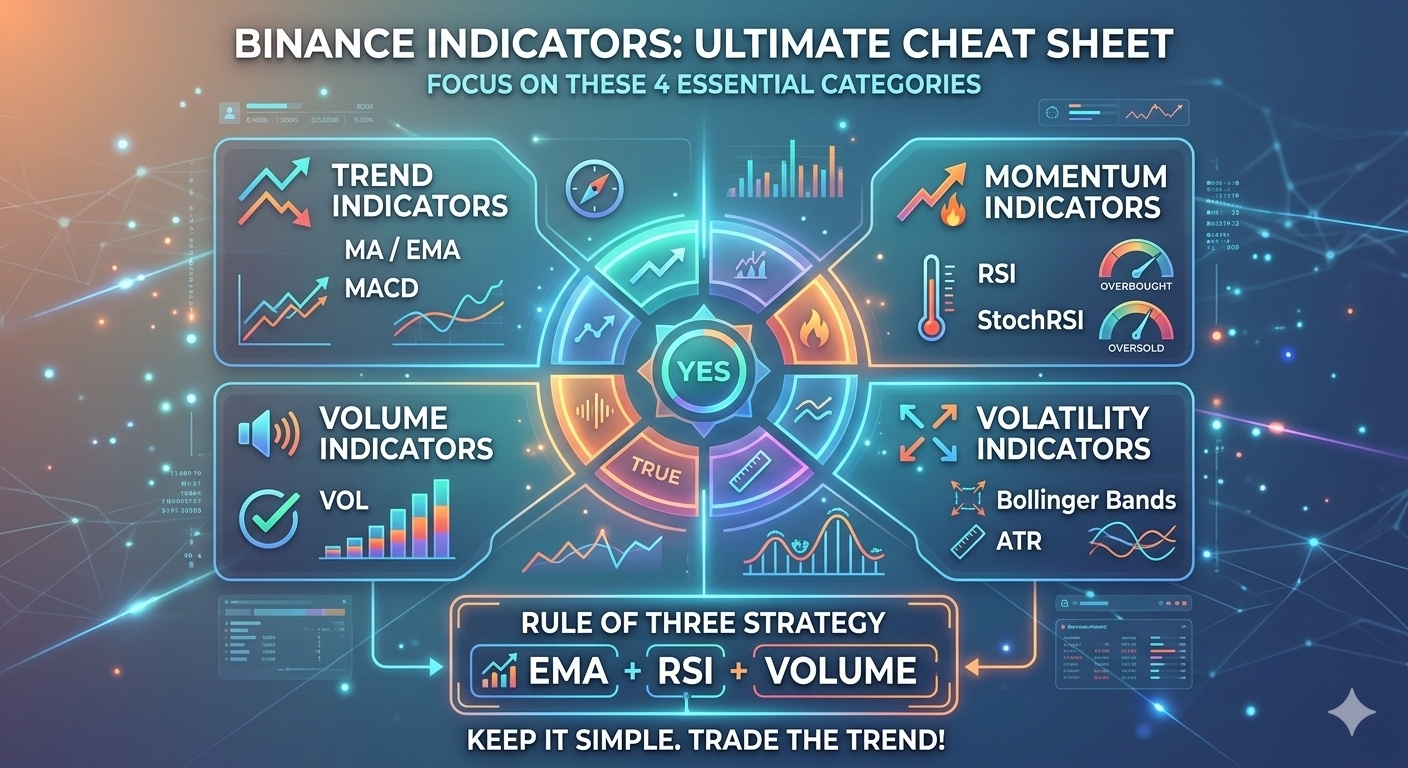
Master the market by focusing on these 4 essential categories. Keep your charts clean and your decisions sharp.
1️⃣ Trend Indicators (The Compass) 🧭
Helps you identify the general market direction.
MA / EMA 📈: Shows average price. Price above the line = Bullish trend.
MACD ⚔️: A crossover of the two lines is your signal for Buy or Sell momentum.
2️⃣ Momentum Indicators (The Power Gauge) 💪
Measures the strength and speed of a price move.
RSI 🌡️: Identifies "Overbought" (>70 = Sell) or "Oversold" (<30 = Buy) zones.
StochRSI ⚡: A faster version of RSI, perfect for quick Scalping entries.
3️⃣ Volatility Indicators (The Explosion Meter) 🎢
Measures price range and predicts big moves.
Bollinger Bands (BOLL) 🎈: When bands "squeeze," a massive breakout is coming.
ATR 📏: The best tool to set a precise Stop Loss (SL) based on market noise.
4️⃣ Volume Indicators (The Confirmation) ✅
Tells you if a move is real or just a trap.
VOL 🔊: High volume confirms a real breakout; low volume suggests a Fakeout.
💡 The "Rule of Three" Strategy 🛡️
Don't clutter your screen. Use only these three together for high-probability setups:
EMA (To find the Trend) 🗺️
RSI (To check the Strength) 🔋
Volume (To Confirm the move) 🤝
"Keep it simple. Trade the trend!" 🦅
#Launchpool #BNB_Market_Update