Bitcoin has endured one of its most volatile periods in recent months, plunging from highs above $125,000 to a low of $63,000 — a -50% correction that shook out weak hands and tested the resolve of even the most convicted bulls. But as the dust settles, a critical question emerges: Is the bottom in?
The Technical Picture: Bullish Reversal Forming
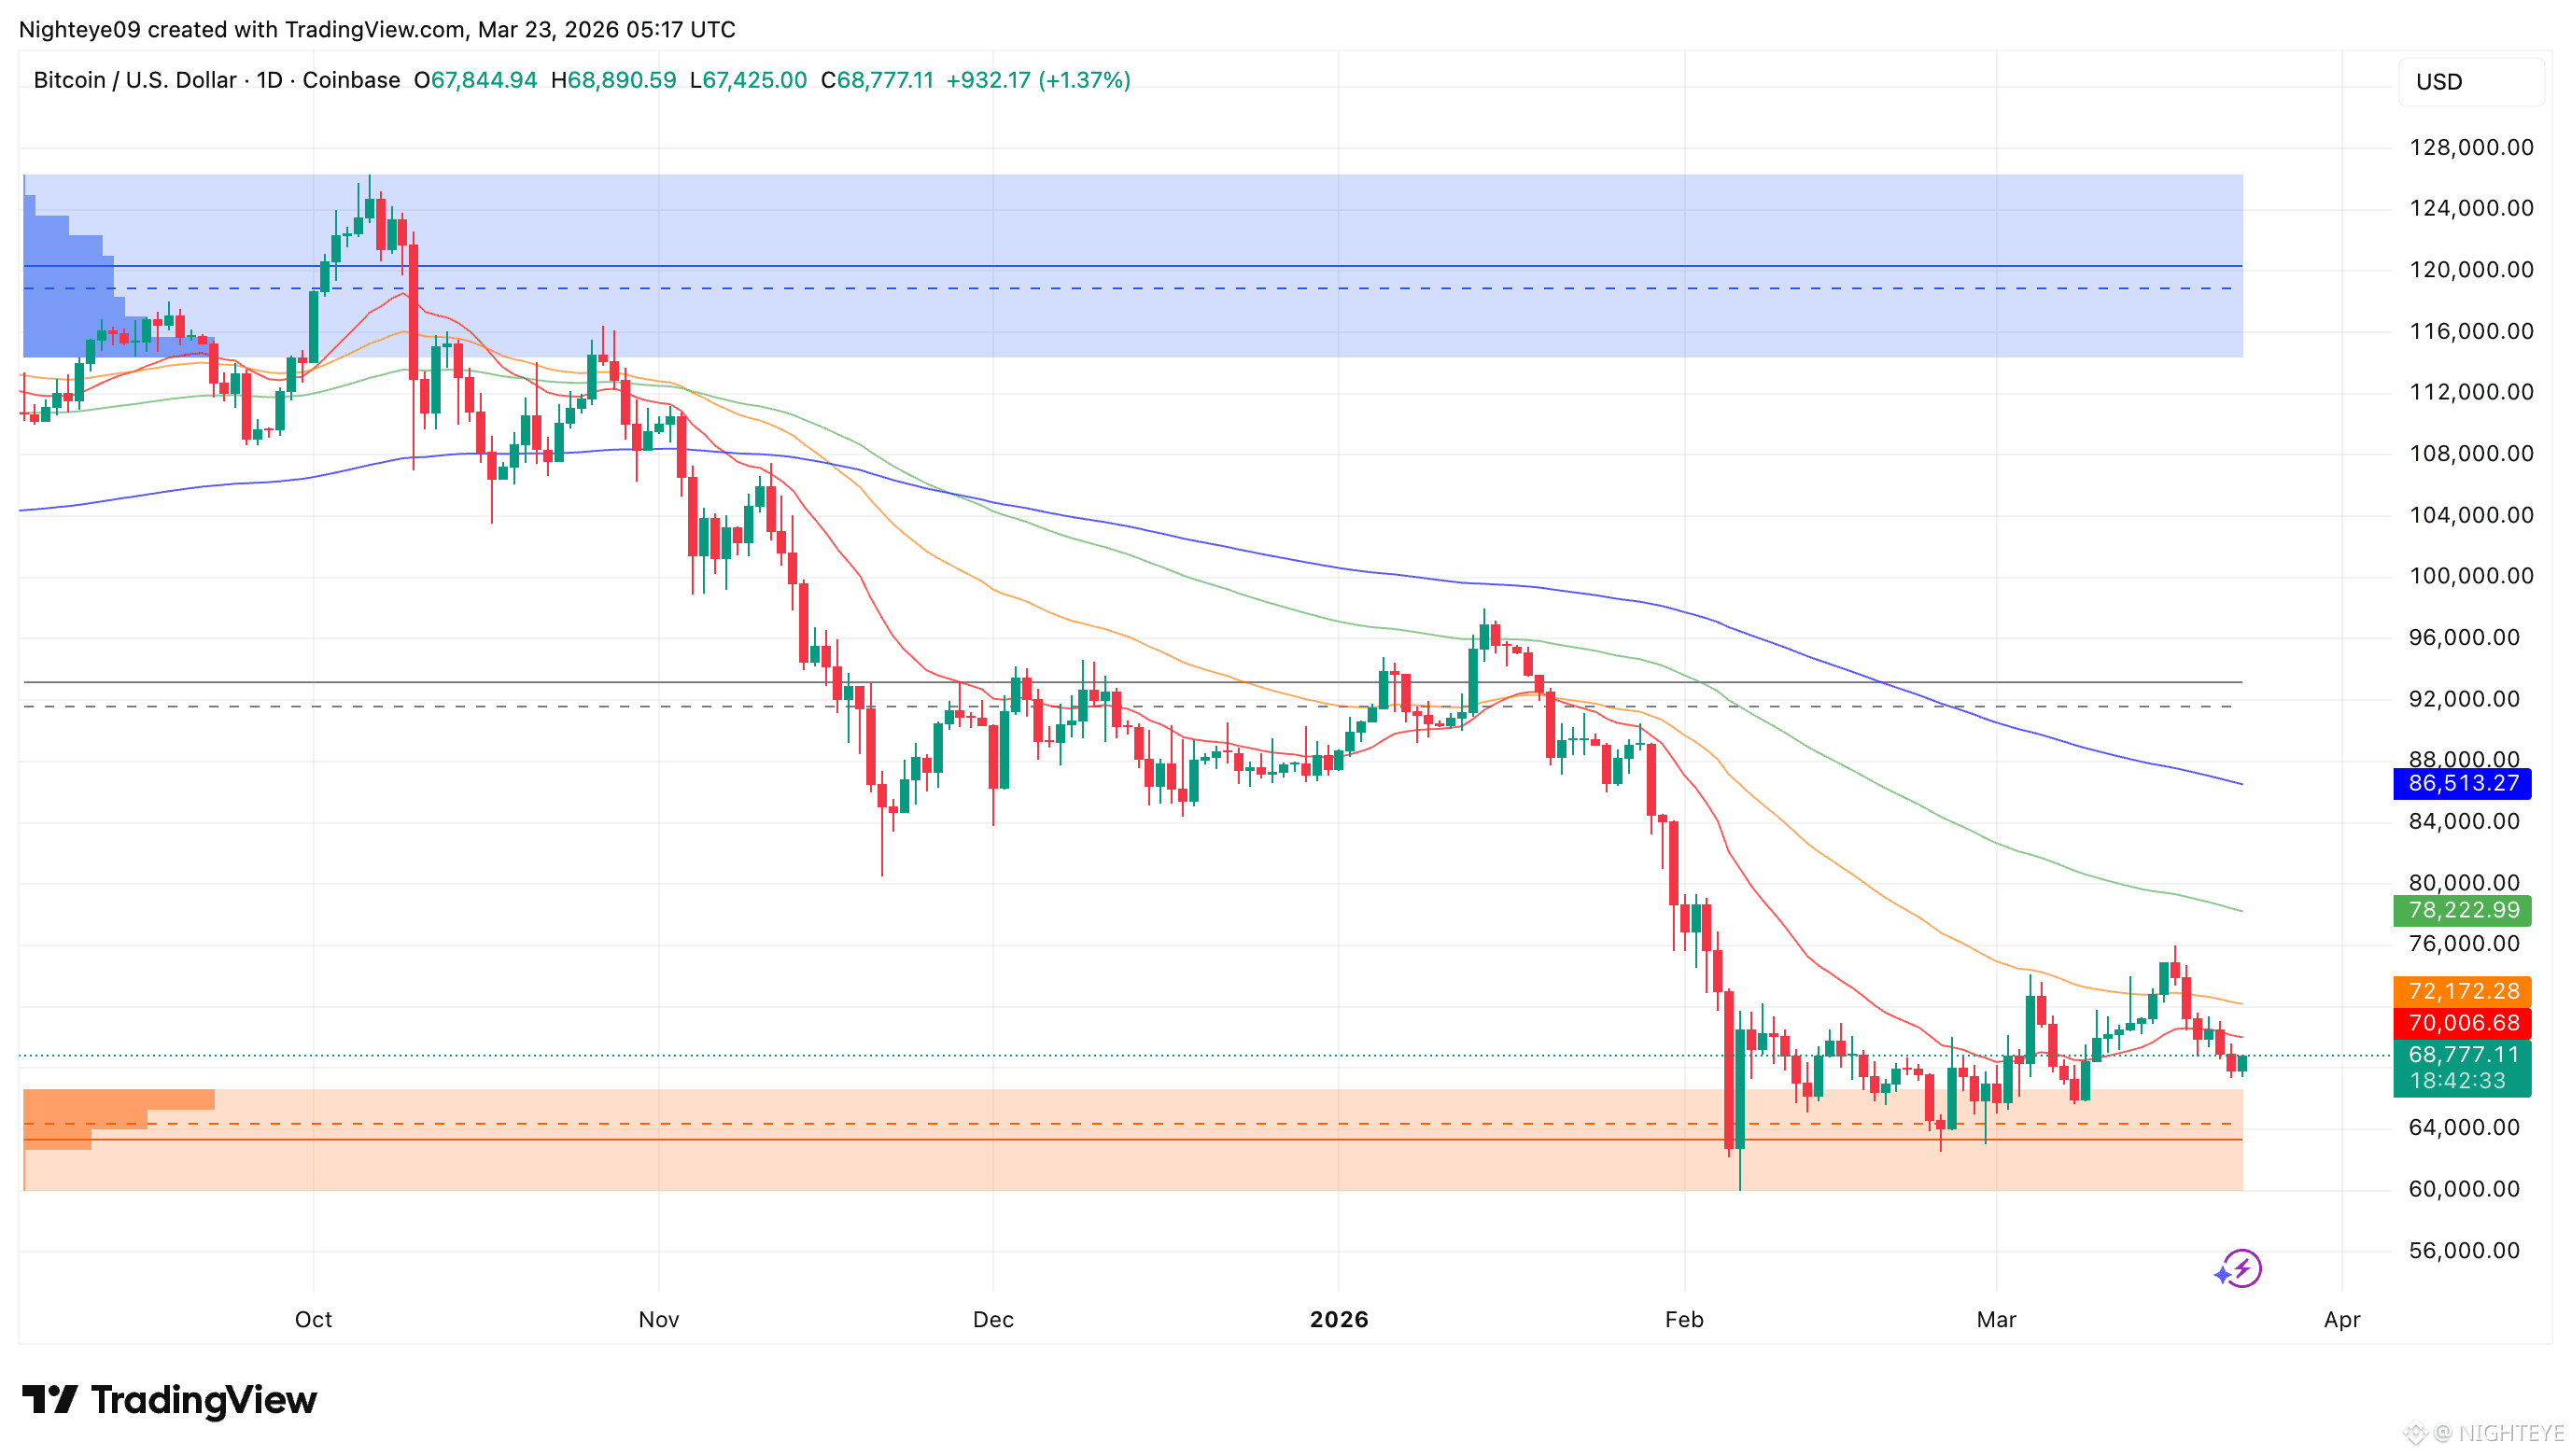
Looking at the daily chart, Bitcoin has done something crucial — it's held support. After bottoming at $63,000 in late February, BTC has formed a series of higher lows, a textbook sign of accumulation and trend reversal.
Key Technical Levels:
Support Zones:
$63,000 - $65,000: Absolute floor, multiple retests held
$67,500 - $69,500: Current entry zone, previous breakdown flipped support
$72,000: First major resistance to reclaim
Resistance Zones:
$78,000: Critical resistance, breakthrough signals continuation
$85,000 - $88,000: Major supply zone from previous rally
$92,000+: Path to six figures opens up
Current Price Action:
Bitcoin is trading at $68,777, hovering just above the Lower Bollinger Band ($67,931). This is a classic bounce zone where historically, strong reversals have occurred.
RSI (Relative Strength Index):
The RSI is sitting at 51.28, having bounced from deeply oversold levels below 30. This bounce indicates that selling pressure is exhausted and buyers are stepping in. Bullish divergence on the RSI (price making lower lows while RSI makes higher lows) is a strong reversal signal.
Bollinger Bands:
Upper Band: $88,513
Middle Band: $78,222
Lower Band: $67,931
Price bouncing from the lower band with the bands beginning to contract suggests volatility is compressing. Historically, periods of low volatility precede explosive moves — the question is which direction.
Volume Analysis:
Volume spiked massively during the capitulation wick to $63,000, indicating panic selling. Since then, volume has normalized but remains elevated on green candles, suggesting accumulation is happening quietly.
Why This Could Be THE Bottom
1. Capitulation Event Confirmed
The drop to $63,000 triggered massive liquidations — over $2 billion in long positions wiped out in 24 hours. This kind of flush typically marks bottoms, not midpoints of bear markets.
2. Historical Support Held
The $63,000 - $65,000 zone represents:
Previous all-time high from the 2021 bull run
Major institutional entry point (based on on-chain data)
200-week moving average support
When these levels hold, they often mark major trend reversals.
3. On-Chain Metrics Support Accumulation
Exchange outflows increasing (coins moving to cold storage)
Whale addresses accumulating (addresses holding 1,000+ BTC growing)
Supply on exchanges at multi-year lows
Long-term holder supply increasing
These signals indicate smart money is buying while retail panics.
4. Macro Environment Improving
Federal Reserve signaling potential rate cuts
Global liquidity conditions improving
Institutional adoption continuing (ETF inflows remain positive)
Bitcoin halving effects still playing out
The Bear Case: What Could Go Wrong
Not everyone is convinced the bottom is in. Here's what bears are watching:
1. Failed Bounce Pattern
If BTC fails to reclaim $72,000 and gets rejected, it could form a lower high, continuing the downtrend. A break below $65,000 would invalidate the reversal thesis.
2. Macro Headwinds
Recession fears still looming
Geopolitical tensions escalating
Potential crypto regulation crackdowns
Correlation with stock market (if SPX dumps, BTC likely follows)
3. Technical Resistance Overhead
The $78,000 - $88,000 zone contains massive supply from traders who bought near the top. Breaking through this will require significant buying pressure.
4. Sentiment Still Too Bullish
Some contrarian indicators suggest retail hasn't fully capitulated yet. True bottoms often come when literally nobody wants to buy.
Trading Strategy: How to Play This Setup
For Conservative Traders:
Wait for daily close above $72,000 before entering
Use tight stop-loss below $67,000
Scale in gradually, don't FOMO all at once
Take partial profits at resistance levels ($78K, $85K)
For Aggressive Traders:
Entry zone: $67,500 - $69,500 (current levels)
Stop-loss: $65,000 (below major support)
Target 1: $72,500 (quick 5% gain)
Target 2: $78,000 (reclaim major resistance)
Target 3: $85,000+ (continuation to new highs)
Risk-Reward Ratio: 3.2:1 — excellent for a major asset like Bitcoin
For Long-Term Holders:
If you believe in Bitcoin's long-term thesis (digital gold, inflation hedge, decentralized money), current levels represent a generational buying opportunity. DCA (Dollar Cost Average) into weakness and hold through volatility.
What to Watch This Week
Critical Price Levels:
Above $72,000: Bullish continuation confirmed
Below $65,000: Reversal invalidated, retest of $63K likely
Chop between $67K-$71K: Accumulation phase continues
Key Events:
FOMC meeting minutes (Fed policy clues)
March jobs report (recession indicators)
Bitcoin ETF flow data (institutional sentiment)
On-chain metrics (whale activity, exchange flows)
Volume Confirmation Needed:
A breakout above $72,000 needs to be accompanied by strong volume (1.5x - 2x average). Low-volume breakouts often fail.
Historical Context: Similar Setups
2020 COVID Crash:
BTC dropped from $10,500 to $3,800 (-64%), then formed a higher low at $4,900. Those who bought the bounce to $6,000-$7,000 caught a ride to $69,000.
2018 Bear Market Bottom:
BTC bottomed at $3,200 after a brutal -85% correction, formed higher lows at $3,400-$3,800, then slowly grinded higher before the 2020-2021 bull run.
Current Setup (2026):
BTC dropped from $125,000 to $63,000 (-50%), now forming higher lows at $67,000-$69,000. Is history repeating?
The Bigger Picture: Why Bitcoin Still Matters
Regardless of short-term price action, Bitcoin's fundamental thesis remains intact:
Scarcity: Only 21 million BTC will ever exist. ~19.6 million already mined.
Adoption: Major institutions, corporations, and even countries now hold BTC. This isn't 2017 retail FOMO — this is structural demand.
Macro Hedge: As governments print unlimited fiat currency, Bitcoin's fixed supply becomes increasingly attractive.
Technology: Lightning Network, Taproot upgrades, and institutional infrastructure continue improving.
Network Security: Hash rate at all-time highs despite price correction. Miners are committed long-term.
Final Verdict: Is the Bottom In?
The evidence suggests YES, but with conditions:
✅ Bullish Signals:
Capitulation event at $63K
Higher lows forming
RSI bullish divergence
On-chain accumulation
Historical support held
Volume profile supports reversal
⚠️ Conditions Required
Must hold $65,000 support
Need to reclaim $72,000 with volume
Break above $78,000 confirms new uptrend
Macro environment stays supportive
❌ Invalidation:
Daily close below $65,000
Lower high forms (rejection at $70K-$72K)
Major macro shock (recession, black swan event)
Bottom Line for Traders
The Setup is There. The Risk is Clear. The Reward is Massive.
Current levels ($67,500 - $69,500) offer an excellent risk-reward for those willing to take calculated risk. With a stop-loss at $65,000, you're risking 5-7% to potentially gain 15-25% in the short-term and 50%+ if the bull market resumes.
For long-term holders: These corrections are gifts. Bitcoin has crashed 50%+ multiple times in its history, and every single time, those who bought the fear were rewarded handsomely.
For short-term traders: Respect the levels. Use stop-losses. Don't overtrade. Let the market prove itself before going all-in.
The bottom might be in. Or we might see one more flush to $60K-$63K. Either way, the risk-reward at current levels favors the bulls over the medium-to-long term.
The question isn't whether Bitcoin will recover — it's whether you'll be positioned when it does.
#bitcoin #BTC #CryptoTrading #TechnicalAnalysis #Binance

👀 DYOR