In the ever-evolving crypto market, success often comes down to one critical factor — timing. Entering too early exposes traders to volatility, while entering too late limits upside potential. This is where the MACD (Moving Average Convergence and Divergence) becomes an essential tool for traders seeking clarity in trend and momentum.
Widely used across financial markets, the Crypto MACD — especially through dashboards like CoinMarketCap — provides a structured way to evaluate trend strength, momentum shifts, and high-probability entry or exit points.
🔍 Understanding the MACD Indicator
MACD is a trend-following momentum indicator that tracks the relationship between two moving averages of an asset’s price. Its strength lies in its ability to simplify complex price behavior into actionable signals.
It consists of three components:
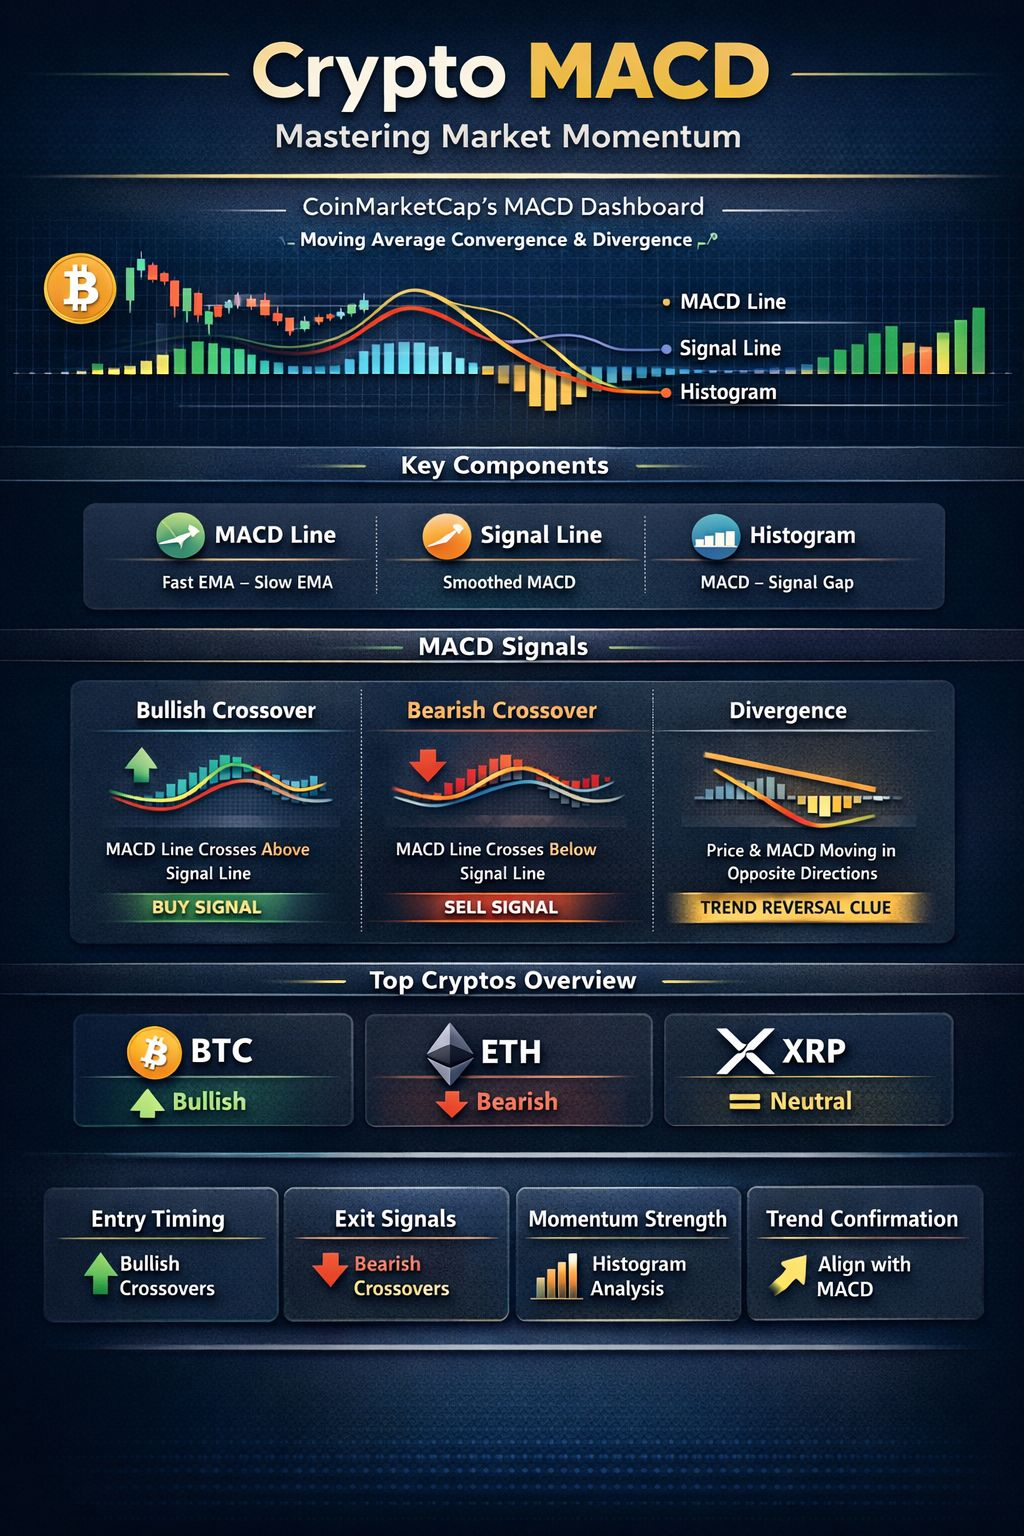
MACD Line — The difference between short-term and long-term moving averages
Signal Line — A smoothed average of the MACD line
Histogram — A visual representation of the distance between the MACD and signal lines
Together, these elements provide a comprehensive view of whether momentum is accelerating or weakening.
⚙️ Interpreting MACD Signals
The true value of MACD lies in its ability to generate clear trading signals:
📈 Bullish Crossover
When the MACD line crosses above the signal line, it indicates strengthening upward momentum. This is often interpreted as a potential buy signal, particularly in the early stages of a trend.
📉 Bearish Crossover
When the MACD line crosses below the signal line, it suggests weakening momentum or a possible reversal. Traders often view this as a sell or exit signal.
🔄 Divergence
Divergence occurs when price action and MACD move in opposite directions. This is a powerful early indicator of a potential trend reversal, often preceding major market shifts.
🌐 MACD Across the Crypto Market
Modern MACD dashboards allow traders to monitor multiple assets simultaneously, providing a broader market perspective. Major cryptocurrencies such as Bitcoin, Ethereum, and XRP can be analyzed in real time to identify where momentum is building — and where it is fading.
This multi-asset approach enables traders to:
Detect emerging trends early
Compare momentum strength across assets
Identify rotation opportunities within the market
📊 Integrating MACD Into a Trading Strategy
Professional traders rarely rely on a single indicator. Instead, MACD is used as part of a broader analytical framework:
Trend Confirmation → Align trades with MACD direction
Entry Optimization → Use bullish crossovers to refine timing
Exit Planning → Monitor bearish signals to protect prprofits.
Momentum Analysis → Evaluate histogram size for trend strength
⚠️ Important Considerations
Despite its effectiveness, MACD is not without limitations:
It is a lagging indicator, meaning signals may follow price movements
In highly volatile markets, false signals can occur
Strong trends can delay reversal signals
To improve accuracy, MACD should be combined with:
RSI for overbought/oversold confirmation
Support and resistance levels
Volume analysis
🧠 Final Thoughts
The Crypto MACD is more than just an indicator — it is a decision-making framework that helps traders interpret market momentum with precision.
In a landscape defined by rapid price movements and shifting sentiment, tools like MACD provide a critical advantage. By identifying momentum shifts early and confirming trend direction, traders can move from reactive decisions to strategic execution.
Mastering MACD is not just about reading charts it’s about understanding the rhythm of the market and positioning accordingly.