Are We in a Consolidation Phase or the Beginning of a New Move?
 Bitcoin experienced sharp fluctuations last week, surging to $76,000 mid-week before retreating in two waves to $67,000, eventually settling near $70,000 by the end of the week.
This movement suggests the market is transitioning from an overbought state to a more balanced and stable phase.
 1️⃣ Spot Market Analysis:
✅ Declining Spot Activity:
We saw a decline in spot trading volumes, with a noticeable slowdown in ETF inflows.
This decrease in institutional demand indicates a loss of immediate momentum, reflecting a more cautious and consolidation-oriented environment.
What does this mean?
The market appears to be taking a short break after the recent rallies, giving investors an opportunity to reassess their positions.
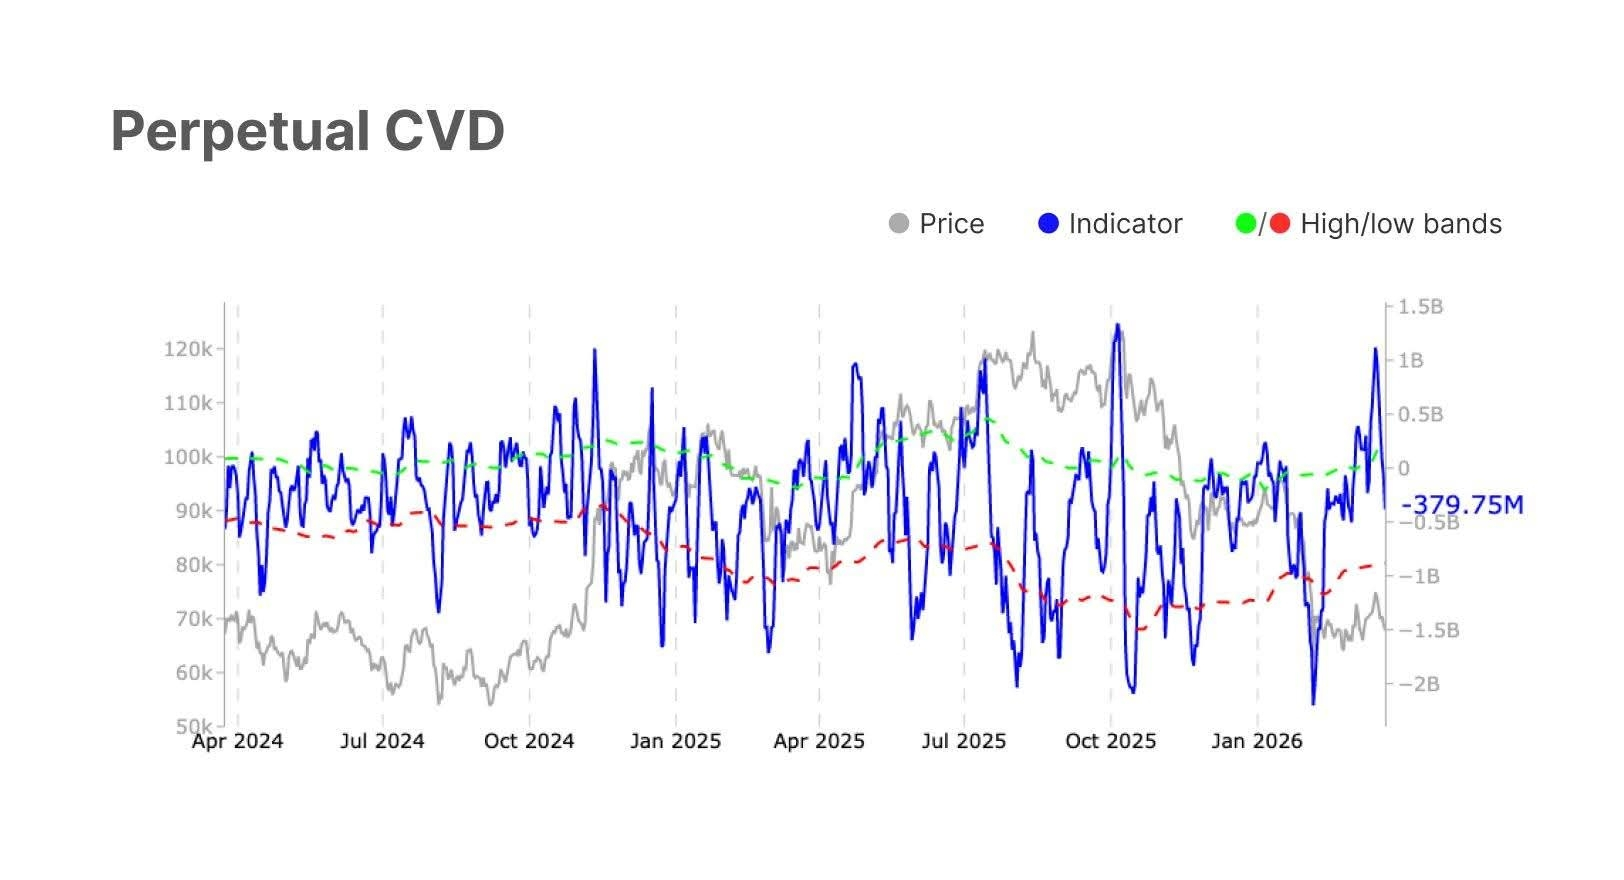
2️⃣ Derivatives Market Analysis:
Defensive Position Shift:
✅ The CVD indicator turning negative reflects increased selling pressure.
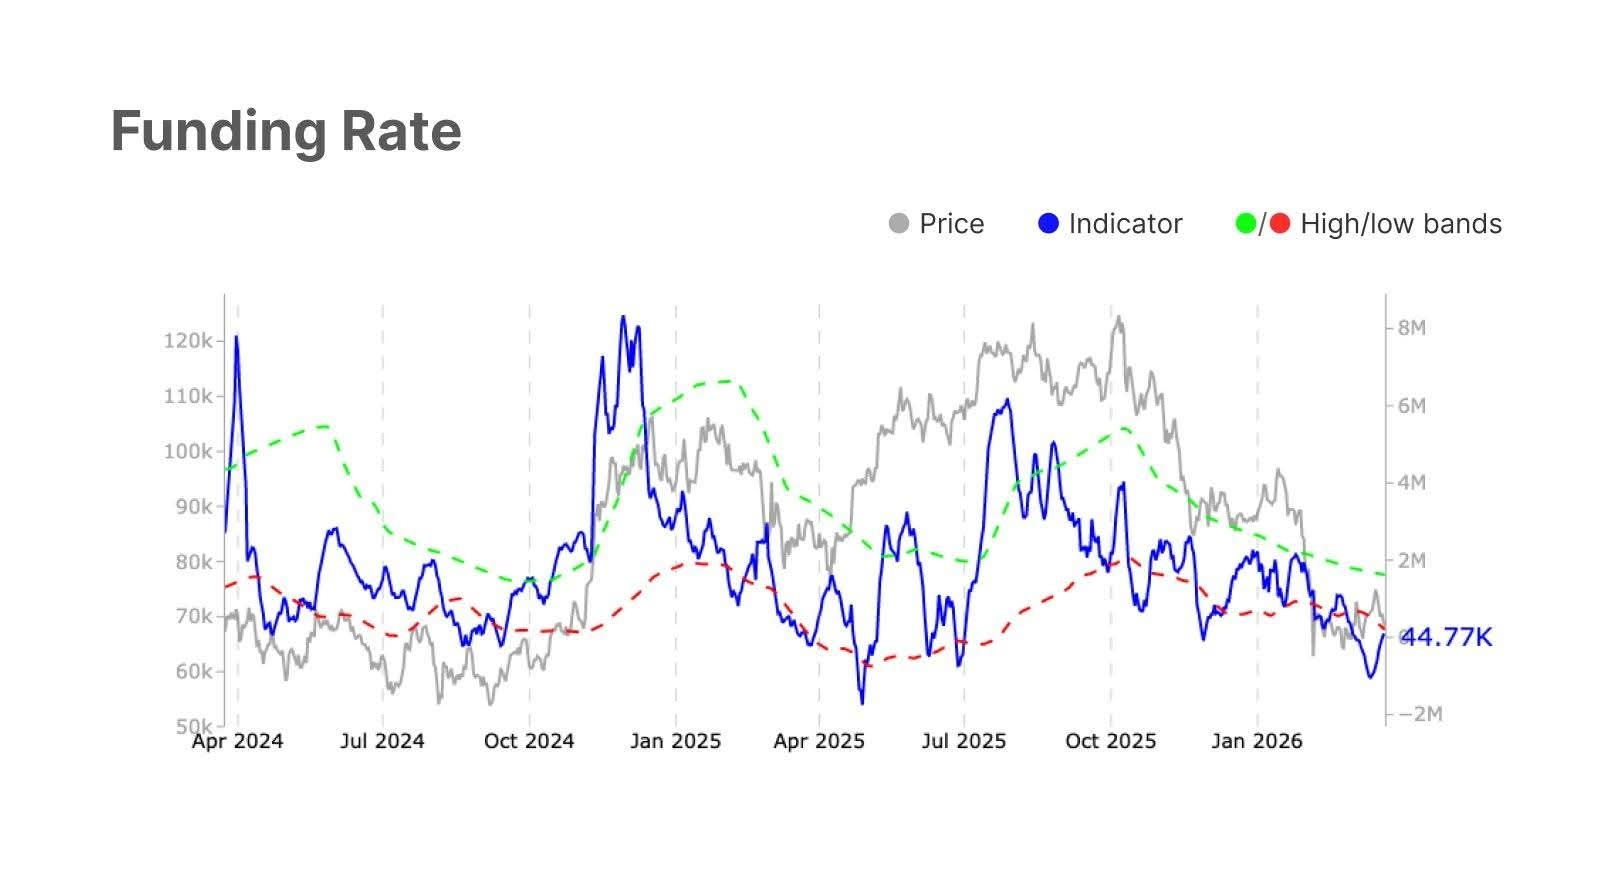
✅A decline in open interest, coupled with a shift in funding rates to positive territory, suggests reduced leverage and cautious new long positions.
3️⃣Options Market:
✅Volatility is stabilizing.
✅A rise in the 25-Delta Skew reflects increased downside protection, indicating cautious trading.
4️⃣ETF Analysis:
✅Slowing inflows:
Declining net inflows and trading volumes suggest reduced institutional participation.
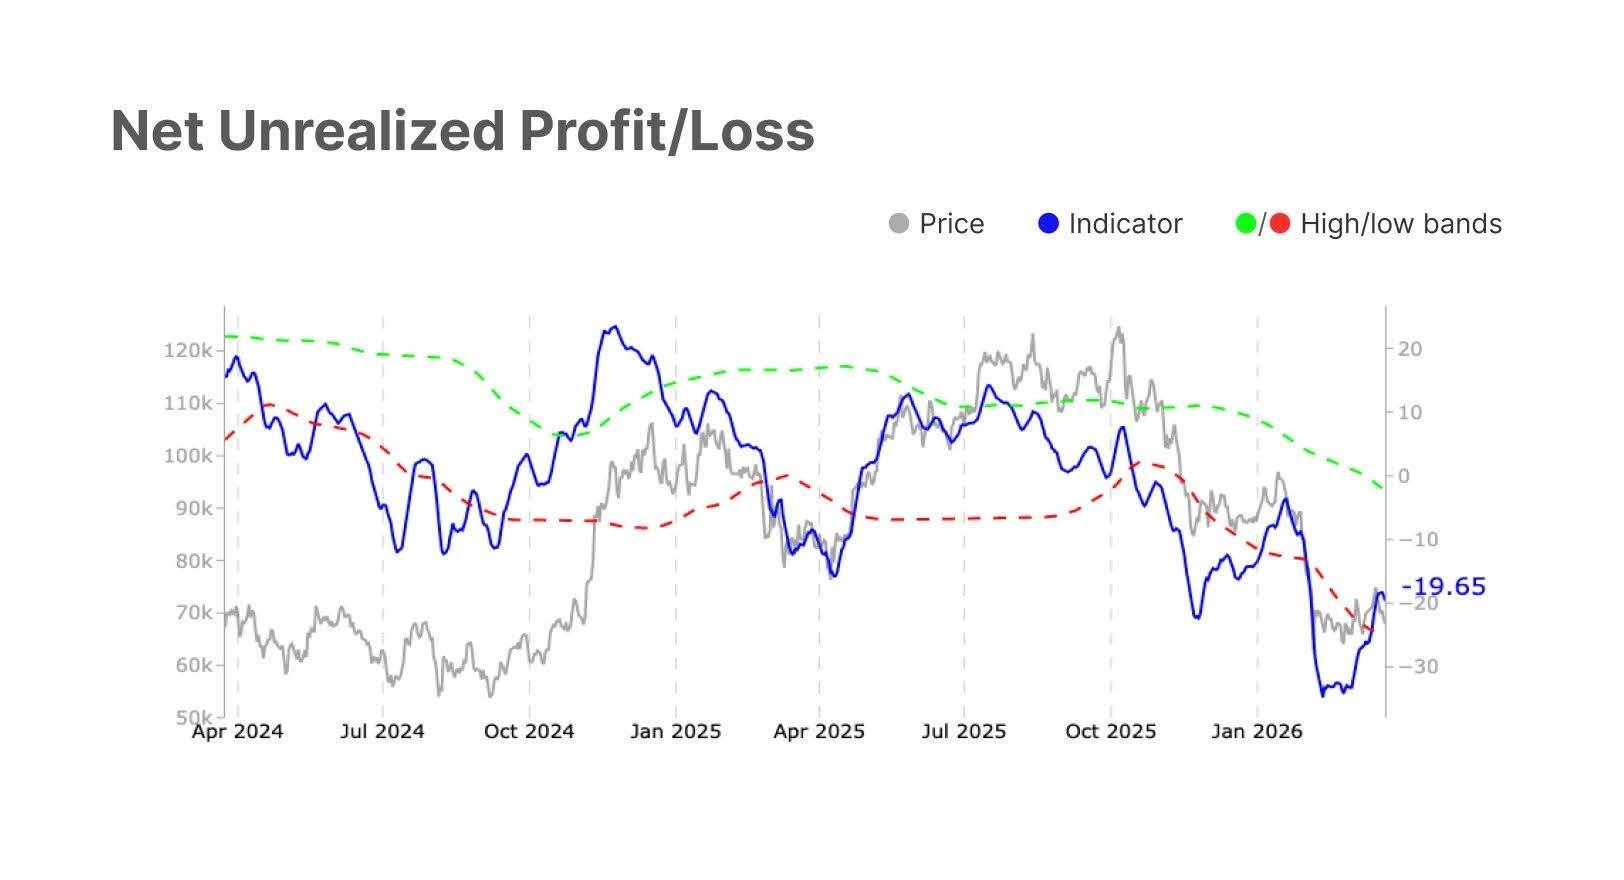
✅Pressure on profitability:
Indicators like MVRV are trending downwards, reflecting greater sensitivity to downside and a tendency towards defensive allocation.
5️⃣On-Chain Activity:
✅Weak activity:
A decrease in the number of active addresses and transaction volumes suggests a slowdown in economic activity.
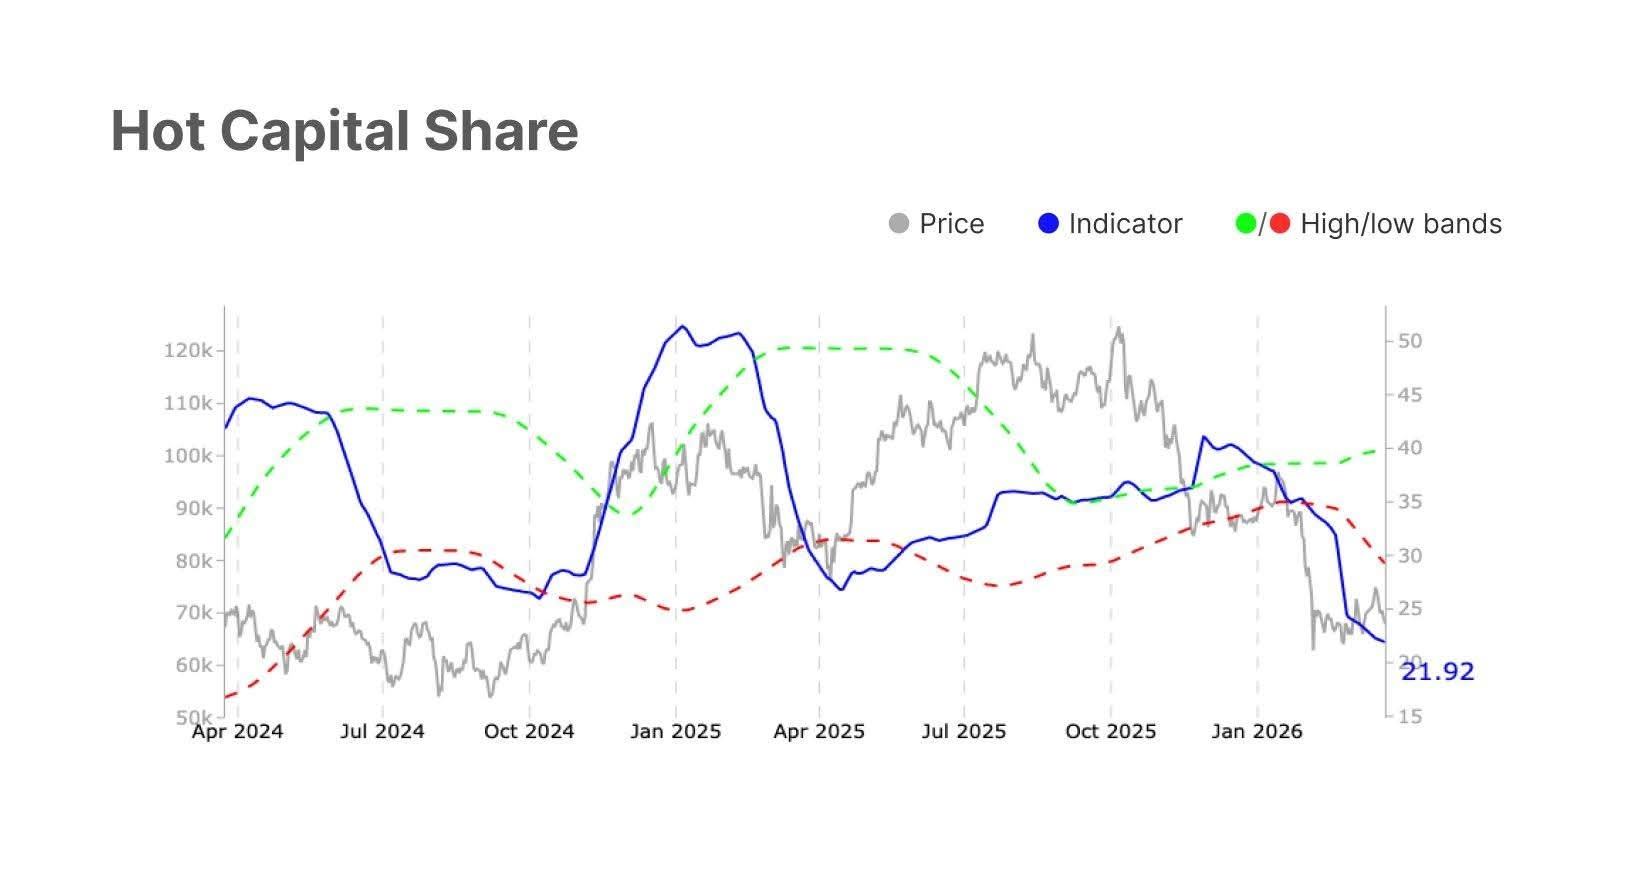
✅Stabilizing capital flows:
However, there are early signs of stabilizing flows, with long holders continuing to dominate supply.
What does this mean for investors?
 This is a consolidation and stabilization phase, where:
1. Spot activity slows, reflecting temporary caution.
2. Derivatives shift to a defensive posture, with new positions being cautiously built.
3. On-chain activity shows signs of stabilization, which could be a positive indicator for the long term.
 Tip
Tip
1️⃣ for day traders:
Use this phase to identify key support and resistance levels.
Focusing on technical analysis will be the key to success.
Share your opinion:
Do you think Bitcoin will retest the $76,000 level soon?
Or are we headed for further declines?
Let us know in the comments ..
👇 Follow me for more professional analysis and strategic tips in the world of cryptocurrencies.
