2026 Digital Asset Strategy: Navigating the Great Divergence in a Stagflationary Era
Monetary Policy and the Contagion of AI-Driven Deleveraging
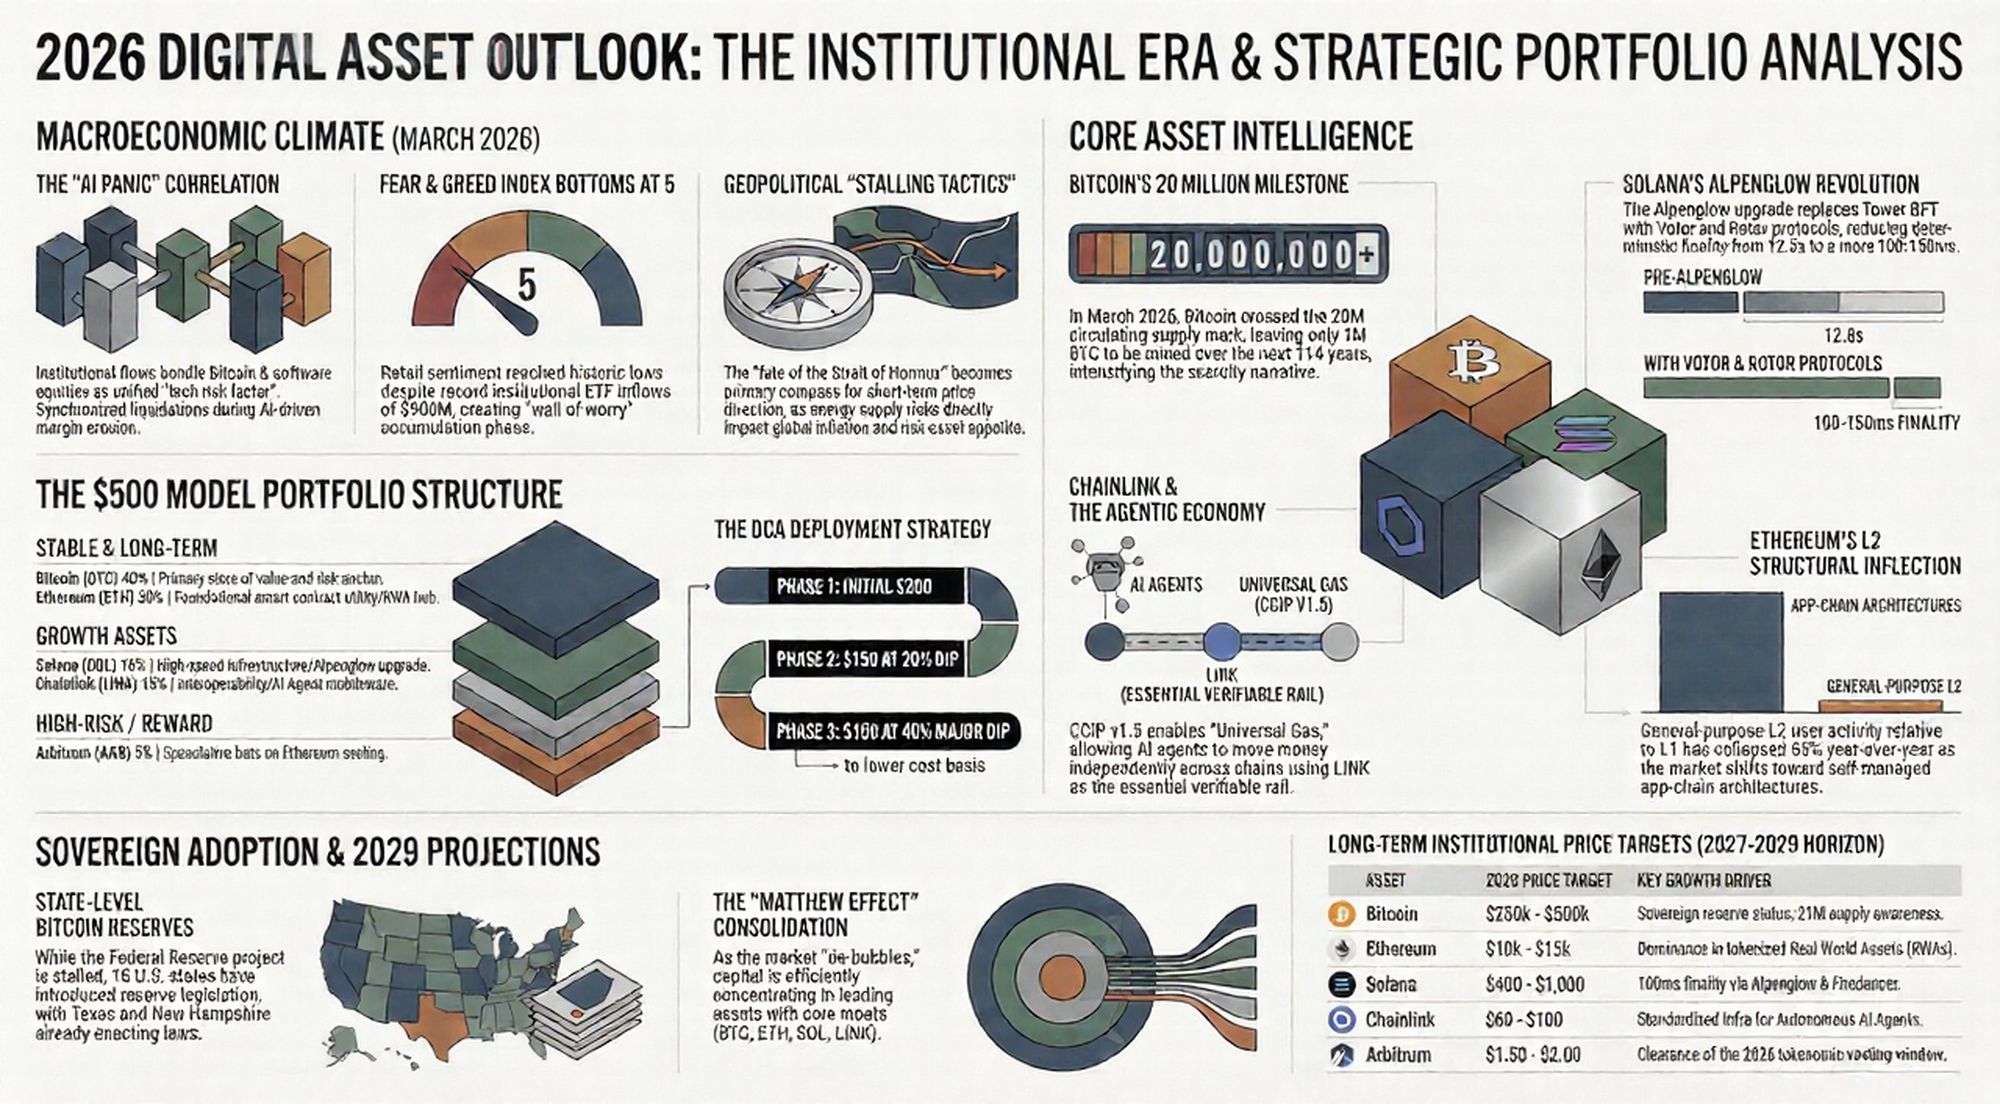
The opening quarter of 2026 has witnessed the definitive end of the "Retail Cycle" narrative, replaced by a sophisticated, institutional-grade paradigm where digital assets are no longer speculative outliers but essential tech-risk factors. The macro environment is currently defined by a "Tightening Trap"—a period of persistent stagflation and a stubbornly hawkish Federal Reserve that has fundamentally recalibrated the risk-return profile of the asset class. Our assessment indicates that institutional liquidations are currently being triggered not by crypto-native catalysts, but by AI-driven margin erosion in the $10 trillion software sector (IGV Index). As institutional allocators now bundle Bitcoin with software equities, the forward P/E compression in SaaS—now at 19x compared to the S&P 500’s 22x—suggests a valuation floor is approaching, but the path to recovery remains gated by central bank constraints.
Monetary Policy: The Inflation Floor
The Federal Reserve has maintained a policy rate of 3.5%–3.75%, explicitly acknowledging that energy-driven inflation cannot be ignored. With the Q4 2026 PCE inflation rate revised upward to 2.7%, the "pivot" narrative of 2025 has transitioned into a "higher-for-much-longer" reality.
Macro Indicator
December 2025 Market Expectations
March 2026 Realities
Fed Policy Rate
Projected 2.5% – 3.0%
3.5% – 3.75% (Unchanged)
Interest Rate Cuts
4 to 6 cuts projected for 2026
1 to 2 cuts (Earliest June)
5-Year Treasury Yield
Projected < 3.5%
4.10% (9-month high)
PCE Inflation (Q4 '26)
2.4%
2.7% (Upward revision)
Geopolitical Volatility: The Strait of Hormuz as a Market Compass
The "Digital Gold" narrative has faced its ultimate stress test in the Middle East. While gold has suffered its largest drop since 1983, Bitcoin has demonstrated superior resilience, outperforming the Nasdaq by nearly 9% in March. However, our intelligence suggests the recent rebound is tied to the Trump administration's "Stalling Tactics." The five-day postponement of strikes on Iranian infrastructure (announced March 23) is likely a logistical necessity to replenish missile inventories ahead of the arrival of the 31st Expeditionary Unit on March 27. This geopolitical tension serves as the ultimate stress test for Bitcoin's supply-side resilience while exposing the thinning margins of smart-contract scaling solutions.
Bitcoin: The Consolidation of a Sovereign-Grade Reserve Asset
Bitcoin has officially entered its "Sovereign Era," catalyzed by the milestone of 20 million BTC in circulating supply. With only 1 million coins remaining to be mined over the next century, the scarcity narrative has shifted from a theoretical concept to an acute driver of institutional and state-level accumulation.
Institutional Liquidity and the Matthew Effect
Capital concentration is accelerating through the "Matthew Effect," where dominant vehicles like BlackRock’s IBIT continue to absorb liquidity despite broader market volatility. We identify three high-signal indicators of this structural shift:
7-Year Inventory Depletion: Exchange reserves have hit a seven-year low, signaling a massive migration of supply into the "Digital Treasury" strategies of corporate and institutional whales.
Corporate Collateralization: Entities like Strategy (holding 762,000 BTC) have effectively rebranded as digital treasury companies, utilizing Bitcoin as the foundational asset for corporate finance.
The Valuation Floor: Despite the tech-linkage, Bitcoin is finding support near its realized price of ~$54k, a level historically indicative of the final stages of a deleveraging cycle.
The Strategic Reserve Mirage: Federal Stagnation vs. State Momentum
One year after Executive Order 14233, the U.S. Strategic Bitcoin Reserve remains an operational "mirage" at the federal level, marked by jurisdictional paralysis.
Metric
Federal Stagnation (Executive Mirage)
State-Level Momentum (Active Integration)
Asset Management
Spreadsheet-based (Marshals Service)
Legally codified treasury integration
Cumulative Action
Zero purchases; 57 BTC sold in violation
Active buying (e.g., Texas $5M purchase)
Valuation Impact
$2.4 Billion loss since EO signing
Direct exposure to 2029 targets
Legislative Status
BITCOIN Act stalled in Congress
TX & NH (Laws enacted); 14 others pending
While federal progress is mired in "obscure legal provisions," the decentralized movement at the state level is bypasssing gridlock. This sovereign accumulation cements Bitcoin as the risk anchor for the broader ecosystem, even as smart-contract platforms face a structural re-valuation.
Ethereum: Structural Inversion and the Layer 2 Crisis
Ethereum’s beta-play status is under systemic review as the L1/L2 value-accrual mechanism fractures. The ETH/BTC ratio has reached multi-year lows, reflecting a structural inflection rather than a mere price correction.
The L2 Value-Accrual Fracture
The "faster Ethereum" thesis for general-purpose rollups is under siege. The L2-to-L1 Daily Active User (DAU) ratio has collapsed from a peak of 10.43 in mid-2025 to just 1.12 in February 2026—a 68% year-over-year decline.
Structural Inversion: Major Layer 2s like Base are increasingly departing from shared stacks to develop self-managed architectures, capturing their own sequencer margins rather than feeding the L1.
Technical Erosion: Advancements in zkVMs and the mainnet scaling roadmap (targeting 10,000 TPS) are rendering general-purpose rollups redundant.
The RWA and Staking Moat
Despite narrative weakness, Ethereum remains the "critical infrastructure" for tokenized Real-World Assets (RWAs) and institutional staking. With a regulated 4% yield and dominance in stablecoin settlement, Ethereum is being re-valued as a productive utility asset. Our proprietary N7 Index (NeoFi), which tracks protocols with recurring fees and institutional convergence, has outperformed Bitcoin by 27% YTD, suggesting that within the Ethereum ecosystem, "Mainnet Re-valuation" is the only trade that matters.
Solana: The Alpenglow Upgrade and Institutional Re-rating
Solana has successfully pivoted from a retail "meme-chain" to a credible backbone for internet-native capital markets. This technical renaissance is led by the Alpenglow overhaul, which replaces the legacy Tower BFT consensus.
Metric
Legacy Tower BFT (Pre-2026)
Post-Alpenglow Targets (H1 2026)
Deterministic Finality
~12.8 Seconds
100 – 150 Milliseconds
Consensus Protocol
On-chain voting overhead
Votor (Off-chain voting)
Execution Integrity
Validator-led reordering (MEV)
ACE (App Controlled Execution)
Theoretical TPS
~65,000
> 1,000,000 (with Firedancer)
The divergence between price and flow is stark: while SOL declined 31% in recent volatility, Solana Spot ETFs saw $900 million in net inflows. The introduction of "ACE" (Application Controlled Execution) provides the auditability required for regulated financial institutions, while "Firedancer" provides the redundancy expected in Tier-1 infrastructure. This high-speed settlement layer is the prerequisite for the emerging machine-to-machine economy.
Agentic Commerce: The Case for Chainlink
Chainlink has established a definitive "Institutional Moat" by positioning itself as the settlement rail for Agentic Commerce. As autonomous AI agents begin to move capital independently, they require decentralized oracle rails for machine-to-machine payments.
CCIP v1.5 and Tokenomic Transformation
The launch of CCIP v1.5 has fundamentally shifted LINK’s tokenomics via the Universal Gas model. Cross-chain fees paid in various assets are programmatically converted to LINK, creating constant, volume-driven buy pressure.
Institutional Convergence: Strategic partnerships with Swift, DTCC, and UBS have turned Chainlink into the backend rail for global institutional settlement.
Development Dominance: Chainlink’s development activity score (275.57) is more than double that of Solana, reflecting its position as the indispensable "DeFi Mullet" infrastructure (institutional front-end, DeFi back-end).
Canton Network Integration: This partnership ensures LINK is the interoperability standard for the $10 trillion tokenized asset market.
Portfolio Construction and 2026–2029 Outlook
In a stagflationary era, the shift from "speculative" to "productive" asset frameworks is mandatory. We recommend a tiered allocation strategy executed via a disciplined three-phase entry.
Model Portfolio Allocation ($500 Baseline)
Component
Weight
Strategic Role
Bitcoin (BTC)
40%
Sovereign-grade risk anchor; store of value
Ethereum (ETH)
30%
RWA hub; productive 4% staking yield
Solana (SOL)
15%
High-performance settlement layer
Chainlink (LINK)
10%
AI Agentic Commerce rails; CCIP demand
Arbitrum (ARB)
5%
High-Risk: "Stylus" and "BoLD" (permissionless validation) upside vs. 100M monthly unlock trap
The Disciplined DCA Execution Strategy
Phase 1 (Current): Deploy 40% of capital at existing levels (Fear Index: 26).
Phase 2 (The Dip): Deploy 30% if BTC tests the $60,000 / ETH $1,800 levels.
Phase 3 (Extreme Fear): Deploy remaining 30% if the Fear Index hits historic lows (<10) or BTC tests realized price (~$54k).
Strategic Targets (2029 Projections)
Asset
2029 Price Target
Primary Growth Driver
Bitcoin
$250k – $500k
Capture of 17% of global store-of-value market
Ethereum
$10k – $15k
Dominance in tokenized real-world assets (RWA)
Solana
$400 – $1,000
Backbone of the Internet Capital Market
Chainlink
$60 – $100
Volume-driven demand from the agentic economy
The digital asset market has transitioned from an experimental phase into a production-grade infrastructure layer. The winners of the 2026–2029 cycle will be those who view these assets not as fringe experiments, but as the fundamental infrastructure of the internet-native capital market. Adhering to this disciplined strategy through macro-volatility is the only path toward capturing the significant ROI potential of the next decade.