Understanding the Pulse: A Learner’s Guide to Crypto Market Health and Momentum
1. The Foundations of Market Analysis
In the volatile landscape of digital assets, market analysis serves as a comprehensive "health check." Just as a clinician evaluates vital signs to diagnose a patient, a quantitative analyst examines specific data streams to determine if an asset is fundamentally robust or structurally weak. We divide this diagnostic process into two primary pillars: Technical Analysis, which maps the "skeleton" of price action and momentum, and On-Chain Analysis, which inspects the "vital organs"—the actual utility and data movement occurring on the blockchain.
Technical vs. On-Chain Analysis
Analysis Type
Primary Focus
The "So-What?" for Learners
Technical
Historical price charts, volume, and mathematical patterns.
Acts as a Risk Thermometer to prevent buying at the peak of a fever or selling during a temporary chill.
On-Chain
Network utility, Total Value Locked (TVL), and wallet activity.
Identifies the Infrastructure Discount—the gap between a network's real-world work and its current market price.
Note: The following data is presented as a Case Study: March 2026 to illustrate these principles in a live market environment.
While understanding the broad definition of market health is essential, we must master the specific technical instruments used to measure the velocity and durability of price trends.
--------------------------------------------------------------------------------
2. Technical Indicators: Gauging Price Momentum
Technical indicators strip away the "noise" of daily social media hype, providing a mathematical framework to identify where an asset sits in its current cycle.
2.1 The Relative Strength Index (RSI): Identifying Overextensions
The RSI is a "momentum oscillator" ranging from 0 to 100. It tells us if the market has pushed a price too far in either direction.
Neutral (Cruising): A reading of 50 indicates a balanced market. Chainlink (LINK) recently demonstrated this stability with an RSI of 49.89.
Near-Oversold (The Opportunity Zone): Readings near 30 suggest sellers are exhausted. Arbitrum (ARB), with an RSI of 35.87, is currently signaling that a local bottom may be forming.
The "So What?": High RSI (above 70) often precedes a "washout" where late buyers are penalized. Conversely, an RSI near 30 historically offers a high-probability entry for patient accumulators.
2.2 Moving Averages (MA): Spotting the Structural Trend
Moving averages smooth out price data to reveal the underlying direction of travel.
7-Day SMA: Short-term "vibe" check.
50-Day SMA: Medium-term trend health.
200-Day SMA: The long-term "line in the sand" for institutional health.
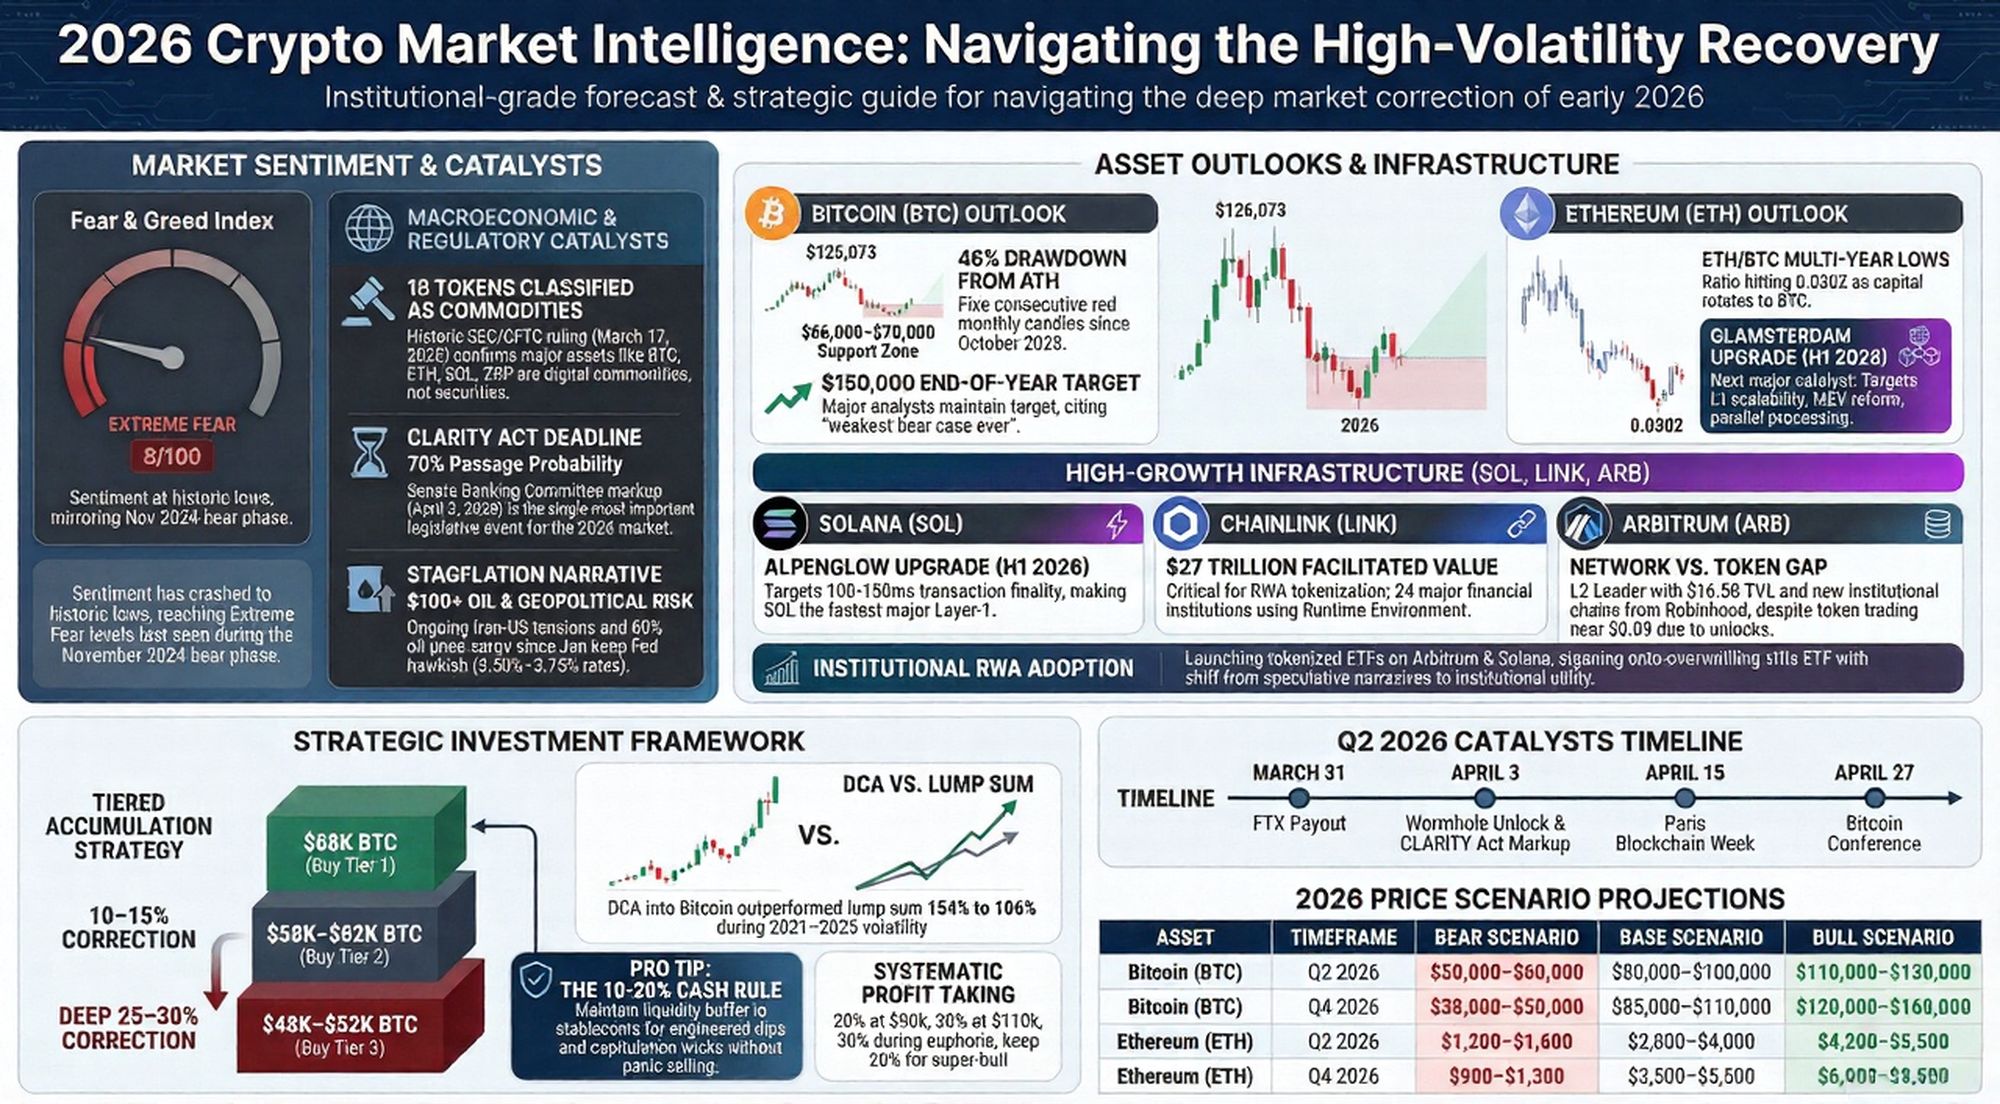
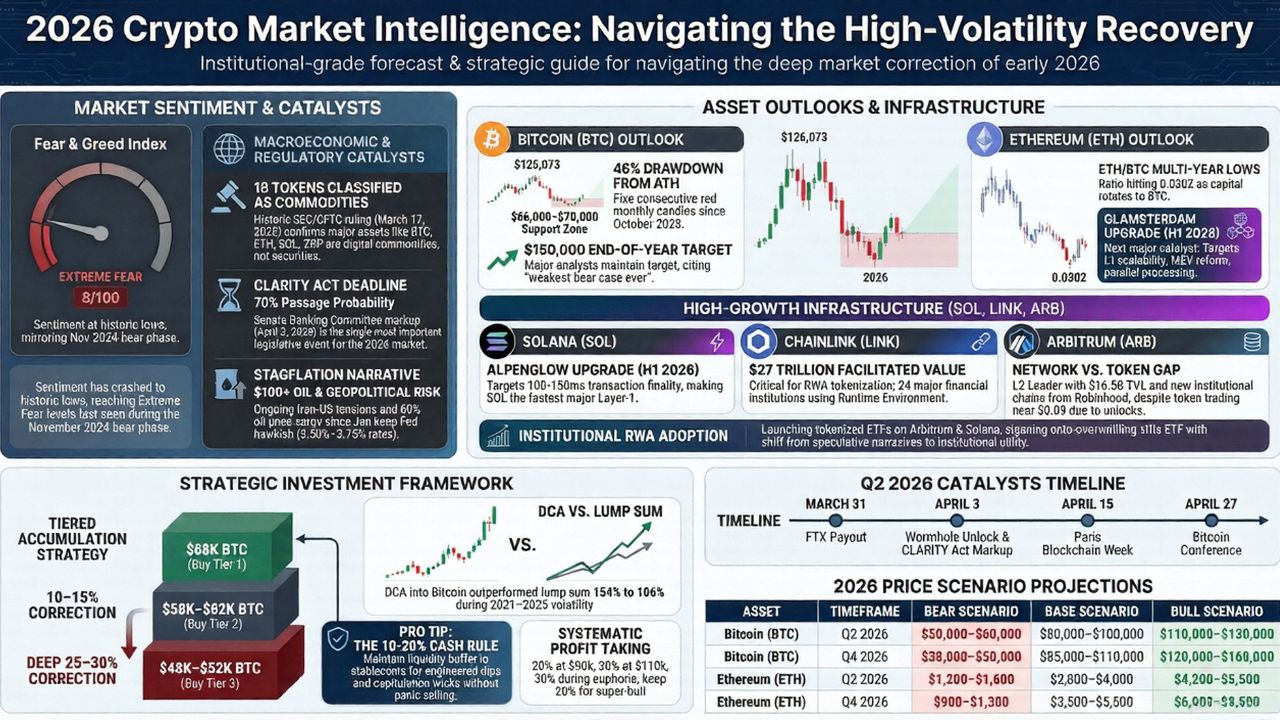
The "Death Cross" Case Study: In November 2025, Bitcoin’s 50-day SMA dipped below its 200-day SMA. This "Death Cross" signaled a regime shift, leading to Benjamin Cowen’s 2026 projection of a potential cycle bottom between $60,000 and $70,000.
The Structural Gap: Analysts watch the distance between current price and the 200-day SMA. For ARB, the current price of 0.09** sits at a massive deficit to its **0.24 200-day SMA.
The "So What?": While this looks like a bargain, the source data reveals a critical supply overhang: 90-100 million ARB tokens are unlocked monthly. This tokenomic pressure explains why the price struggles to gravitate back toward its 200-day average.
2.3 Bollinger Bands: Measuring the "Volatility Envelope"
Bollinger Bands represent the standard deviation of price. When the price touches the "Lower Band," it is statistically stretched to the downside. ARB’s current proximity to its lower band at $0.09 suggests an oversold state ripe for a "relief rally" back toward the median.
Technical indicators show us the skeleton of the market, but sentiment tells us how much "skin" the human players still have in the game.
--------------------------------------------------------------------------------
3. Market Sentiment: The Fear and Greed Index
The Fear and Greed Index measures the "Market Mood," scoring from 0 (Panic) to 100 (Euphoria). In early 2026, we have witnessed "Extreme Fear" levels as low as 8 or 9.
The Contrarian Insight For the novice, a Fear index of 8 is a reason to run. For the Senior Analyst, this represents the Maximum Opportunity Window. Institutional buyers look for the "Infrastructure Discount"—where high-utility assets are sold off by retail traders during periods of Extreme Fear. When the crowd is terrified, the "weak hands" have usually already sold, leaving only a path for recovery.
Psychological sentiment provides a "vibe check," but to find the ground truth of a network's value, we must look at the hard data recorded on the blockchain.
--------------------------------------------------------------------------------
4. On-Chain Metrics: Measuring Real-World Utility
On-chain metrics allow us to ignore what people say and focus on what they are actually doing with the technology.
4.1 Facilitated Value and Network TVL
Network utility is the "gravity" that eventually pulls price back toward reality.
Chainlink: Has facilitated over $27 trillion in transaction value.
Arbitrum: Maintains a Total Value Locked (TVL) of $16.5 billion.
The "So What?": When utility metrics (like $27T in value) remain high while token prices are 80% below their peaks, it creates an "Infrastructure Discount." You are effectively buying a global utility at a liquidated price.
4.2 The NVT Ratio: The "Crypto Speedometer"
The Network Value to Transactions (NVT) ratio is essentially the "P/E Ratio" of the crypto world.
Under 50: The "Value Zone" (undervalued).
Chainlink’s NVT (78): Using the Speedometer Metaphor, LINK is currently at "cruising speed." It isn't idling in the driveway (undervalued <50), but it isn't redlining (speculative excess >150). It is in moderate territory where price is reasonably supported by usage.
4.3 CCIP and the Institutional Floor
Chainlink’s Cross-Chain Interoperability Protocol (CCIP) averages $90 million in weekly volume. This represents real-world adoption by financial institutions, creating a "fundamental floor" that remains intact even when retail sentiment is at "Extreme Fear."
Armed with the data, we move from the "what" to the "how": the practical strategy for entering these positions safely.
--------------------------------------------------------------------------------
5. Practical Execution: Entry Strategies for Learners
The "magical" ability to profit isn't about perfectly timing a bottom; it is about your "Strategy Strategy."
Lump Sum vs. Dollar-Cost Averaging (DCA)
Feature
Lump Sum Investing
Dollar-Cost Averaging (DCA)
Definition
Investing all cash at once.
Investing fixed amounts at regular intervals.
Risk Level
High (Potential to buy a local peak).
Low (Averages out your entry price).
Psychological Stress
Extreme (Fear of immediate drawdown).
Minimal (Consistency kills emotion).
Historical Edge
Outperforms DCA 68% of the time.
Safer for beginners in volatile markets.
The Saylor Methodology: MicroStrategy employs a relentless DCA model, accumulating Bitcoin regardless of price. This "Strategy Strategy" focuses on total asset accumulation over years, effectively ignoring the month-to-month volatility that scares away short-term traders.
The Learner’s Roadmap: Tiered Accumulation (2026 Targets)
Based on Stoic AI and TradingView data, learners should use a Tiered Entry model to manage risk during a "Death Cross" year:
Tier 1 (Current Market): Deploy 30-40% at BTC $68,000 and ETH $1,960.
Tier 2 (The Correction): Deploy 30% if BTC hits 58,000–62,000.
Tier 3 (Capitulation): Deploy 20% if BTC reaches 48,000–52,000.
Reserve: Keep 10% in stablecoins for "Extreme Scenarios" (38k–45k).
--------------------------------------------------------------------------------
6. Conclusion: The Balanced Analyst’s Mindset
Successful trading is the synthesis of the three pillars: Technicals (the skeleton), Sentiment (the skin), and Utility (the vital organs). A "Death Cross" or an RSI of 30 are merely clues; the ultimate tool for survival is disciplined risk management.
The 3 Most Critical Takeaways
Supply is the Silent Killer: Technical gaps (like ARB at $0.09) are often explained by underlying tokenomics (90M+ monthly unlocks). Never trade a chart without checking the supply.
Sentiment is a Mirror: Periods of "Extreme Fear" (Index 8-9) are the only times "Infrastructure Discounts" exist. Buy the fear, sell the euphoria.
Utility is the Floor: Networks with trillions in facilitated value have a reason to exist that transcends temporary price action. Follow the "work" being done on-chain to find lasting value.