Tokenomics in Action: A Case Study of Audiera ($BEAT) Supply Management
1. Introduction: The Seesaw of Crypto Economics
In the sophisticated field of Web3 economics, price is not merely a reflection of sentiment but the result of rigorous Supply-Side Volatility Management. To evaluate the long-term viability of a protocol, one must analyze the tension between Inflationary and Deflationary forces as they move toward Equilibrium Price Discovery.
Inflationary Forces: These represent an expansion of the circulating supply, typically through scheduled "unlocks" or ecosystem incentives. Without a corresponding surge in demand, these forces exert downward pressure on the token’s individual value.
Deflationary Forces: These involve the permanent removal of tokens from the active supply (e.g., via "burn" mechanisms), increasing scarcity and theoretically stabilizing or enhancing the asset’s value relative to its market capitalization.
Effective supply management is a delicate balancing act—a strategic effort to ensure that the "weight" of new emissions does not exceed the ecosystem's Absorption Capacity.
Teacher’s Note: Imagine a high-end economy where the currency is used to access exclusive services. If the central authority suddenly doubles the amount of currency in circulation (Inflation), each unit loses purchasing power. However, if that currency is required to "fuel" a machine and is destroyed upon use (Utility-Driven Deflation), the currency maintains its value because its supply is tethered to actual economic productivity.
In this masterclass, we use the Audiera ($BEAT) project as our real-world laboratory to observe how these opposing economic vectors interact within a modern Generative AI Architecture.
--------------------------------------------------------------------------------
2. The Deflationary Force: The Weekly Burn Mechanism
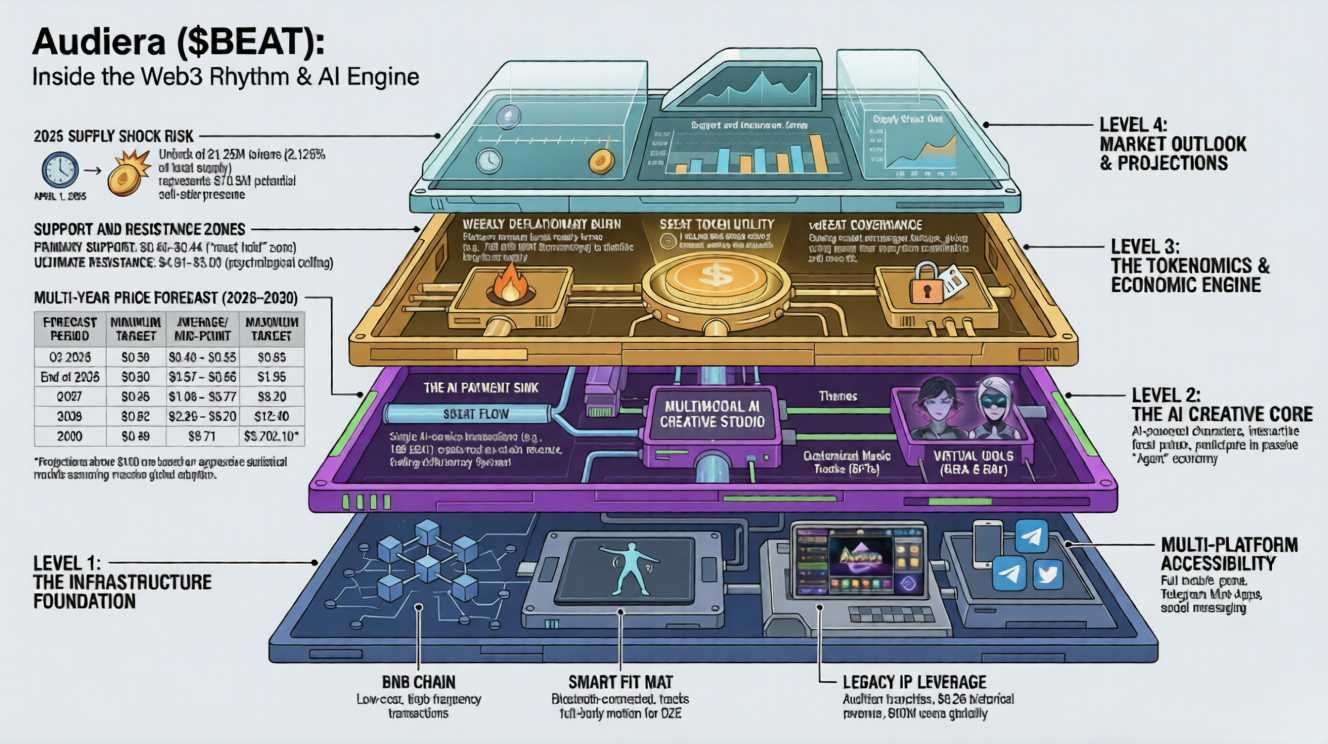
Audiera implements a sophisticated "Revenue → Consumption → Destruction" flywheel designed to counteract natural supply expansion. Unlike static treasuries, this mechanism ties token scarcity directly to the productivity of its Agent-Native Economy.
Activity
Economic Impact
AI Music Payments
High-frequency transactions where users pay in $BEAT to generate tracks; single 100 $BEAT payments create a consistent "sink."
Phygital Hardware Fees
Usage of the Smart Fit Mat for "Dance-to-Earn" (D2E) rewards generates platform revenue that feeds the burn cycle.
Weekly Burn Cycle
A systematic destruction of tokens derived from real income; in January 2026, 250,630 $BEAT were burned in a single week.
Key Insight: This burn is the primary signal of "Scarcity through Utility." By grounding the deflationary pressure in real-world hardware usage (Fit Mat) and AI service consumption, the project aims to ensure that the token’s value is a derivative of ecosystem health rather than mere speculation.
While these burns provide a structural brake on supply, scheduled "unlocks" introduce periodic inflationary shocks that test the market's resilience.
--------------------------------------------------------------------------------
3. The Inflationary Force: Scheduled Token Unlocks
A "token unlock" is a programmed event where restricted assets (vested by the team or investors) enter the liquid market. On April 1, 2026, at 9:00 AM UTC+8, Audiera faced a significant supply expansion with the release of 21.25 million tokens, valued at approximately $44 million.
The Macro Risks of Dilution:
Increased Sell-Side Pressure: The sudden availability of 21M liquid tokens can overwhelm existing buy orders.
Market Capitalization Dilution: Current holders experience a reduction in their "percentage ownership" of the total network.
Short-Term Volatility: Speculative "front-running" often occurs as traders anticipate the drop, frequently reflected in an Extreme Fear sentiment (Fear & Greed Index Value: 8).
The Economic Math: Dilution Adjustment
To quantify this impact, we calculate the Dilution Factor (D):
Current Circulating Supply: 139.30 Million $BEAT
New Unlock Amount: 21.25 Million $BEAT
Calculation: D = \frac{139.3 + 21.25}{139.3} \approx \mathbf{1.152}
The Academic "So What?": A Dilution Factor of 1.152 implies a 15.2% expansion in circulating supply. For the price to remain stable during this event, the protocol’s Market Capitalization must grow by 15.2% simultaneously. To mitigate this, Audiera deployed a Counter-Cyclical Catalyst: the Binance Alpha Trading Competition, which offered 400,000 $BEAT in rewards to stimulate the liquidity needed to absorb the influx.
Sophisticated participants ignore 2D price movements and focus on "Market Microstructure" through volumetric depth.
--------------------------------------------------------------------------------
4. Advanced Insight: Visualizing Supply through 3D Volumetric Analysis
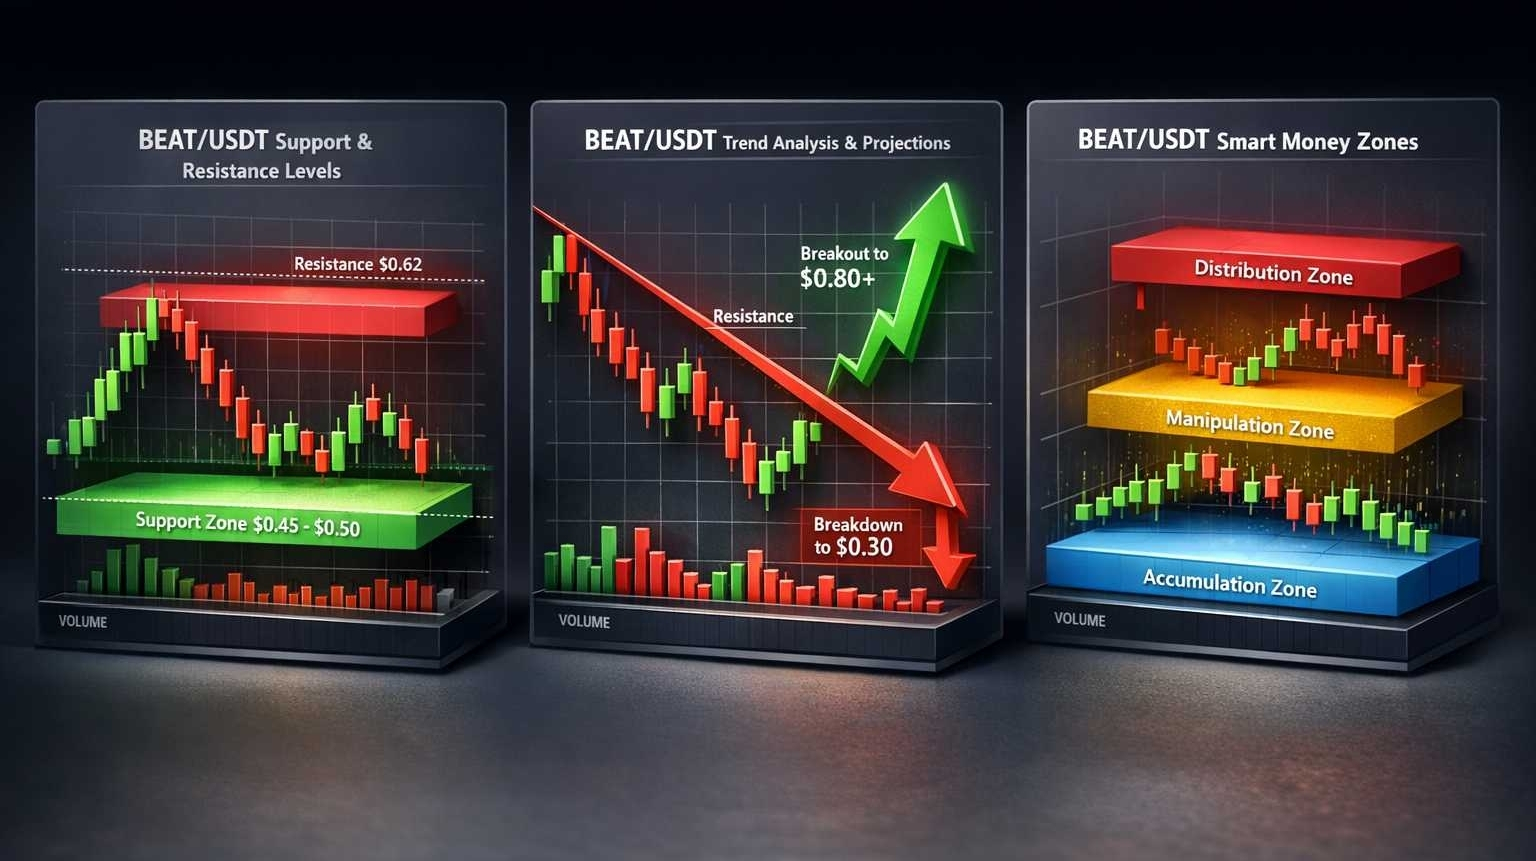
Traditional 2D charts only display historical execution. To understand Order Flow, we utilize 3D Volumetric Analysis, which introduces a Z-Axis (height and color intensity) to represent Resting Orders—the true indicator of market intent.
The Z-Axis Resistance (The Ceiling) Volumetric heatmaps identified a massive "wall" of ask orders in the $0.65 – $0.70 range. This Z-axis peak represents the concentration of sell orders from early investors, creating a structural ceiling that requires massive buying volume to breach.
The Z-Axis Support (The Floor) Conversely, "Liquidity Floors" were detected between $0.40 and $0.44. These are dynamic blocks of buy orders that increase in "height" (Z-Axis intensity) as price drops. This visualization reveals Iceberg Orders—large institutional buy orders executed in small increments to hide intent—waiting to absorb the unlock.
Key Concept: Price Absorption Price Absorption occurs when the newly unlocked supply is consumed by these "resting" buy orders at the $0.40 support floor. If the floor holds despite the 15.2% dilution, it signals that "Smart Money" views the Extreme Fear (Index: 8) as a contrarian buying opportunity, essentially "pricing in" the inflation.
--------------------------------------------------------------------------------
5. Synthesis: Comparing Inflationary vs. Deflationary Pressures
The long-term equilibrium of Audiera ($BEAT) is determined by whether the Utility-Side Demand can outpace the Emission-Side Inflation.
Feature
Force Direction
Primary Benefit/Risk
Weekly Token Burns
Deflationary (Supply ↓)
Benefit: Offsets dilution and creates an "Economic Sink" via AI services.
April 2026 Unlock
Inflationary (Supply ↑)
Risk: Requires a 15.2% Market Cap growth to maintain price parity.
Trading Competitions
Counter-Cyclical (Volume ↑)
Benefit: Generates the "Absorption Capacity" to handle supply shocks.
D2E (Smart Fit Mat)
Fundamental (Demand ↑)
Benefit: Tethers token value to physical health activity and real revenue.
Final Takeaway: The ultimate metric of success in tokenomics is the Absorption Ratio. A project can sustain massive unlocks if, and only if, its ecosystem generates enough high-frequency utility (AI music generation, hardware usage) and liquidity (trading competitions) to "eat" the new supply without collapsing the floor.
--------------------------------------------------------------------------------
6. Knowledge Check & Summary
Evaluating Scarcity Mechanisms: Deflationary protocols are only effective if they are "earned" through real revenue cycles, such as Audiera's weekly burn of ~250k $BEAT driven by AI music and phygital hardware.
Dilution as a Growth Target: A Dilution Factor (D=1.152) isn't just a risk; it is a mathematical requirement for the ecosystem to increase its Market Capitalization by the same percentage to maintain price stability.
Intent vs. History: While 2D charts show where the price was, 3D Volumetric analysis reveals where "Smart Money" is—specifically looking for "Iceberg Orders" and "Liquidity Floors" (e.g., 0.40-0.44) to survive inflationary events.