Este é um gráfico semanal do Bitcoin (BTC/USD) da Bitstamp, cobrindo agosto de 2011 até meados de abril de 2026. Você vê, após meio século neste NEGÓCIO, o ativo não importa—os gráficos sempre contam a mesma história de ganância e medo humanos.
1. RESUMO DOS DADOS
Símbolo: BTC/USD @Bitcoin $BTC

Intervalo de Tempo: Semanal
Total de Barras: 766 semanas
Intervalo de Datas: 2011-08-15 a 2026-04-13
Último Fecho: 75,641
Máxima Histórica no Conjunto de Dados: 126.272 (Semana de 2025-10-06)
Média do Intervalo das Barras: Aproximadamente 3.800 pontos (altamente distorcido pela volatilidade recente)
2. ANÁLISE DE TENDÊNCIA
A TENDÊNCIA PRINCIPAL está alta desde a sua criação em 2011, mas a TENDÊNCIA INTERMEDIÁRIA está atualmente em uma fase corretiva complexa. Vimos um grande topo de explosão em outubro de 2025 a 126,272. Desde então, o mercado tem feito topos e fundos mais baixos até o fundo recente em 59,930 em fevereiro de 2026.
A tendência está atualmente Revertendo. Quebramos a sequência de topos mais baixos, mas estamos testando novamente os níveis de quebra principais. Período.
3. NÍVEIS CHAVE (Retrações de 126,272 Alta para 15,479 Baixa)
Antes de fazermos qualquer coisa, olhamos para a matemática do último ciclo principal.
100% (ATH): 126,272
78,6% de retração: 102,485
66,7% (2/3): 89,300 (A "Última Resistência" para os Bulls)
50,0% Balanço: 70,875 ← ESTAMOS AQUI
33,3% (1/3): 52,410
0% (Baixa Maior): 15,479 (Nov 2022)
4. ANÁLISE DE OSCILAÇÕES RECENTES
Alta Maior: 126,272 (Out 2025)
Baixa Maior: 59,930 (Fev 2026)
Movimento Medido: A queda foi de 66,342 pontos.
A Reação: A atual alta de 59,930 alcançou 78,384. Esta é uma recuperação de 18,454 pontos, que é quase exatamente 27% da queda — muito fraca.
5. ANÁLISE DE BARRA DE IMPULSO
Olhe para a semana de 2026-02-02. A faixa foi de 19,371 pontos (Alta 79,301 para Baixa 59,930). Esta é uma grande Barra de Impulso.
Regra: O alto de uma barra de impulso de baixa (79,301) se torna resistência MAJOR.
Projeção de Preço: Desde que fechamos abaixo do ponto médio daquela barra na época, projetou um movimento para o nível de 60k, que atingimos.
Projeção de Tempo: Aquela barra foi há 11 semanas. Estamos nos aproximando de um quadrado de tempo Fibonacci de 13 semanas.
6. STATUS DE BARRA DE REVERSÃO
Temos um SINAL DE COMPRA em jogo. Veja, a barra mais baixa do movimento recente foi na semana de 2 de fevereiro de 2026 (Baixa 59,930). A alta daquela barra foi 79,301. Ainda não a superamos. No entanto, a baixa de oscilação imediata foi 64,955 (23 de março). Agora superamos as altas das últimas quatro semanas.
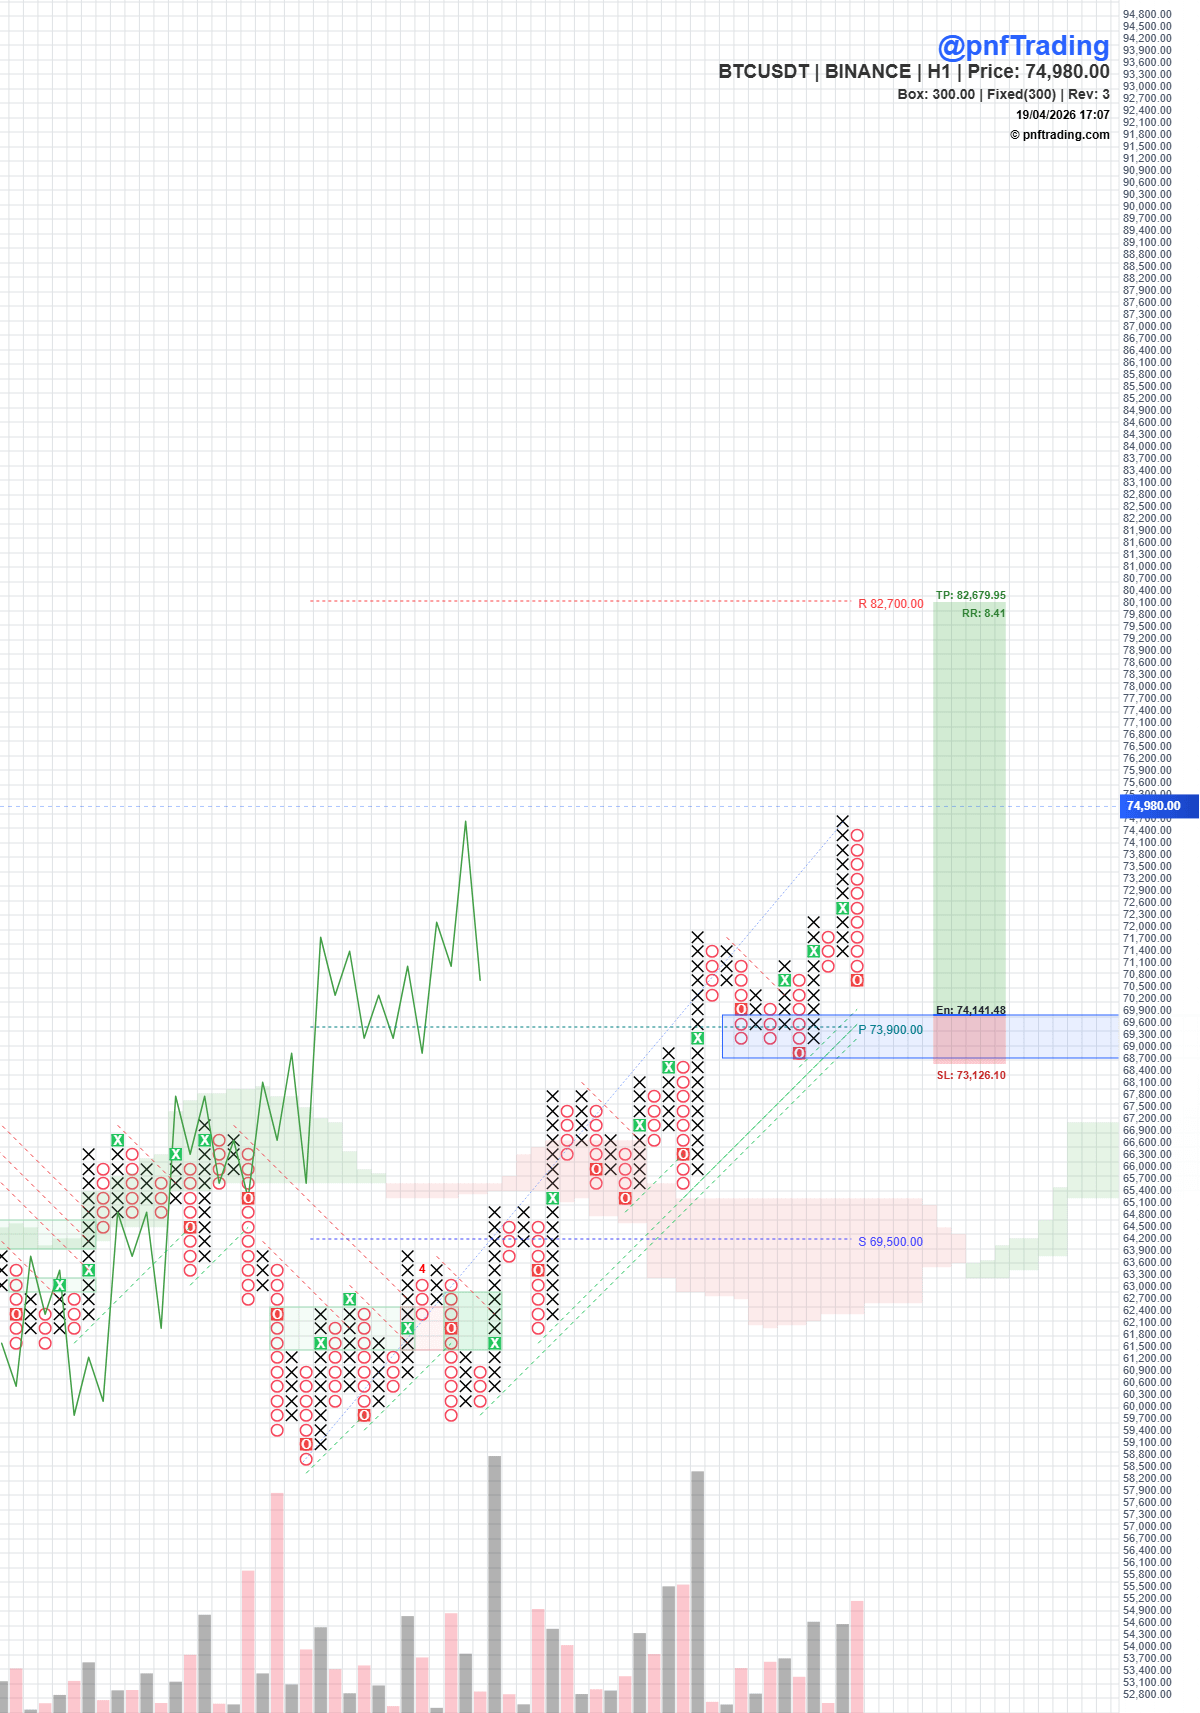
7. AVALIAÇÃO DA AÇÃO PREÇO ATUAL
O mercado está atualmente lutando com o nível de retração de 50% (70,875). Se o Bitcoin não conseguir fechar e se manter acima de 71,000, toda essa alta é apenas um "rebote de gato morto" em um novo mercado de baixa. Período.
O volume tem diminuído neste movimento de alta a partir de 59k. Isso NÃO é o que você quer ver em um mercado em alta saudável. Isso me diz que os "insiders" não estão comprando; eles estão apenas deixando o mercado flutuar para cima pela falta de pressão de venda.
8. CONFIGURAÇÃO DE NEGÓCIO
Direção: NEUTRAL (Aguardando confirmação)
Gatilho Longo: Um FECHAMENTO semanal acima de 79,301 (Alta da Barra de Impulso).
Gatilho de Venda: Uma quebra abaixo de 70,584 (Baixa da semana atual).
Stop Loss: Se longo, 64,955. Se curto, 78,384.
Alvo: Se a resistência de 79,301 quebrar, o alvo é 93,000 (a retração de 2/3). Se falharmos aqui, voltaremos a testar 59,930 e provavelmente 52,410.
9. COMENTÁRIO
Em 50 anos, vi esse padrão mil vezes. Uma corrida maciça para 126k seguida por um "corte de cabelo" de 50% para 60k. O mercado agora está no "Ponto de Reconhecimento." Se ainda for um mercado em alta, DEVE retomar imediatamente o nível de 80,000. Se parar aqui em 75k, o estoque ainda está muito pesado, e os profissionais começarão a pressionar as vendas novamente.
O gráfico mostra que estamos em um ponto crítico de equilíbrio, e o baixo volume sugere que a alta é suspeita. Período.
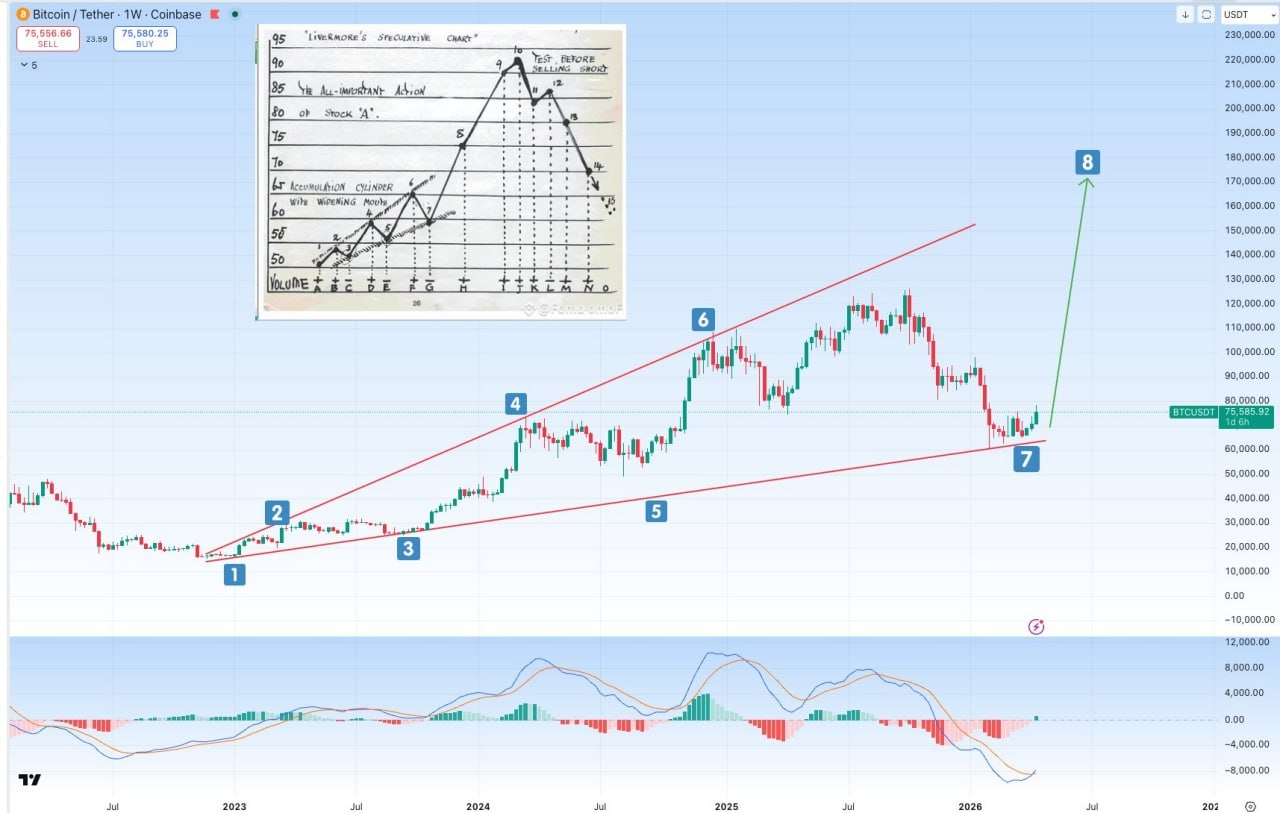
$BTC O cilindro de Acumulação de Livermore mostra que um super ciclo está se desenrolando — alvo de $200K.
Se isso se concretizar, estaríamos entrando na Fase 8.
MACD acaba de confirmar um cruzamento de alta e está se tornando verde. Você precisa mudar a tendência agora.
Não desista disso!