As of April 28, 2026, BNB/USDT is showing a cooling period after a strong rally earlier in the month. While the long-term outlook remains bullish due to ecosystem expansion, the short-term indicators suggest a potential pullback or consolidation phase.
## 📊 Market Snapshot
*Current Price:** ~$634.74
*24h Trend:** Slightly bearish (down from local highs near $654)
*Sentiment:** Cautious/Neutral (RSI ~34–60 across different timeframes)
### Key Technical Levels
| Level Type | Price Point | Significance |
|---|---|---|
| Major Resistance | $655 – $675 | The local high; needs high volume to break. |
| Pivot Point | $631 | Current battleground for bulls and bears. |
| Immediate Support | $615 | Short-term psychological and technical floor. |
| Strong Support | $585 – $590 | Convergence of previous accumulation zones. |
## 📈 Trading Idea: The "Pullback Entry"
Given the current bearish divergence on some 4-hour histograms and the RSI cooling off from overbought territory, the most strategic move is to wait for a retest of support rather than chasing the current price.
### Setup (Spot or Low-Leverage Long)
*Entry Zone:** $610 – $620 (Look for a bounce off the $615 support).
*Target 1 (Conservative):** $650 (Near recent resistance).
*Target 2 (Aggressive):** $680 – $700 (End-of-month bullish projection).
*Stop Loss:** Below $585 (If this breaks, the structure turns bearish).
### Technical Reasoning
1. MACD: Showing a bearish crossover on shorter timeframes, indicating momentum is slowing down.
2. Moving Averages: BNB is trading near its 50-day EMA ($631). Holding above this level is critical for the "Strong Sell" signals seen on some indicators to flip back to "Buy."
3. Volume: Recently declining on upward moves, suggesting the rally might need a "reset" before the next leg up.
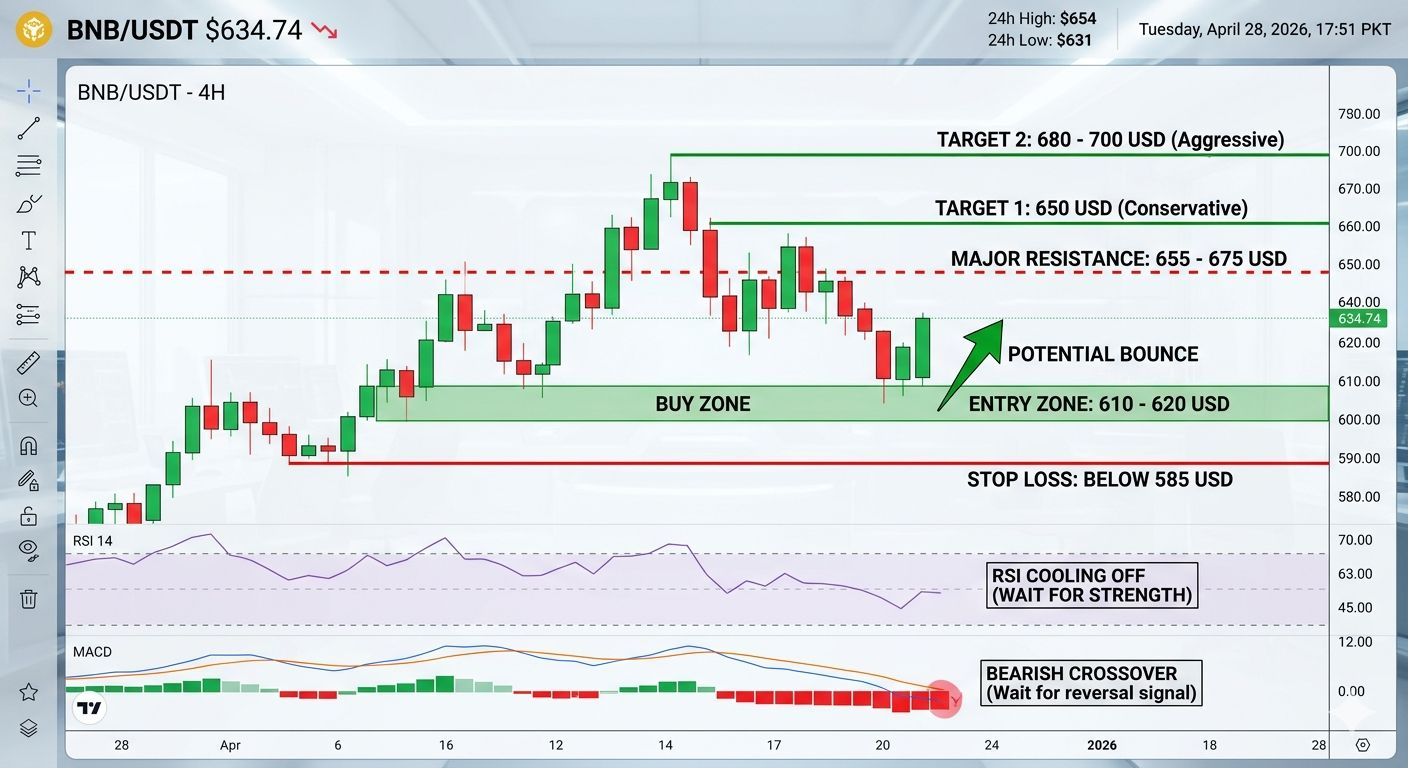
## 🖼️ Visual Representation
(Imagine a candlestick chart with the following annotations)
> [ CHART VISUALIZATION ]
> *Trendline:** A rising support line connecting the lows of early April ($585) to now.
> *The Box:** A green "Buy Zone" shaded between $610 and $620.
> *The Arrow:** A projected bounce trajectory from the $615 level up toward the $680 mark.
> *Indicator Alert:** RSI moving downward from 70 toward 45, showing "room to breathe" before the next pump.
>
### ⚠️ Risk Warning
The crypto market in April 2026 remains highly sensitive to Bitcoin’s volatility (currently near $77k). If Bitcoin drops significantly, BNB’s support levels at $615 may not hold. Always use a stop loss and never trade more than you can afford to lose.