
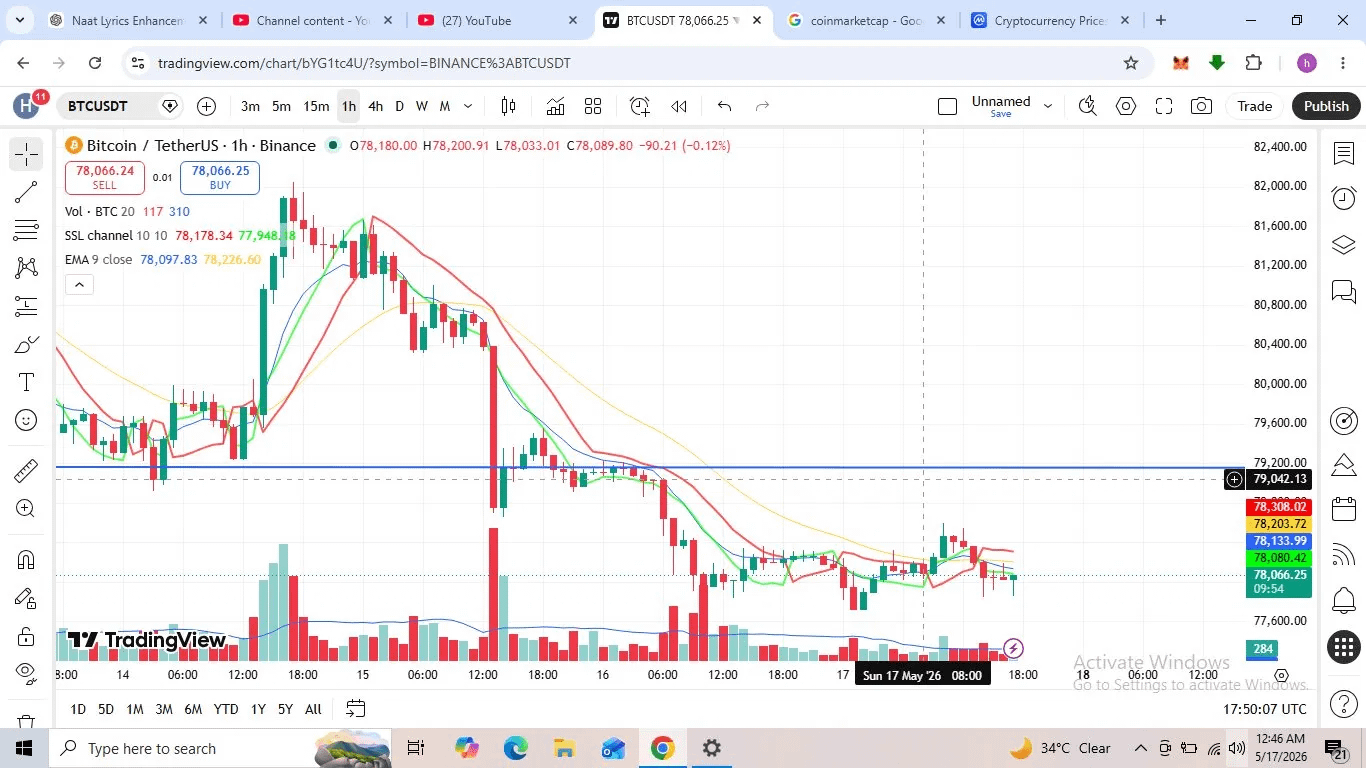
🔍 What the Chart Shows
 BTC74,082.07+0.61%
Price is in a downtrend after rejecting from ~$82,400, now consolidating near $78,000–$78,200
SSL Channel: Upper $78,178 / Lower $77,948 — price is sitting right inside the channel, bearish lean
EMA 9: $78,097 (close), $78,226 (yellow) — price is just below both, confirming weak momentum
Blue horizontal level: $79,200 — this is a key resistance / previous support
Volume: Declining on recent candles — no strong conviction yet
🟢 LONG (Buy) Setup
PriceEntry Zone$77,900 – $78,100 (current area, near SSL lower band)Stop Loss$77,500 (below recent low structure)Target 1$78,800Target 2$79,200 (blue resistance line)R:R~1:2
✅ Condition: Only enter long if price holds above $77,900 with a bullish 1H candle close and volume picking up.
🔴 SHORT (Sell) Setup
PriceEntry Zone$78,300 – $78,500 (near EMA 9 & SSL upper band rejection)Stop Loss$78,700Target 1$77,700Target 2$77,200R:R~1:2
✅ Condition: Enter short on a failed retest of EMA 9 (~$78,097–$78,226) with bearish candle rejection.
⚠️ Key Levels to Watch
LevelType$79,200Strong resistance (blue line)$78,200Immediate resistance$77,900Near support$77,200Major support (dotted line on chart)
Bias: Slightly Bearish — the overall structure shows lower highs and price failing to reclaim EMA. The short setup has a higher probability unless $78,300+ holds as support.
⚠️ This is technical analysis for educational purposes only, not financial advice. Always manage your risk.