
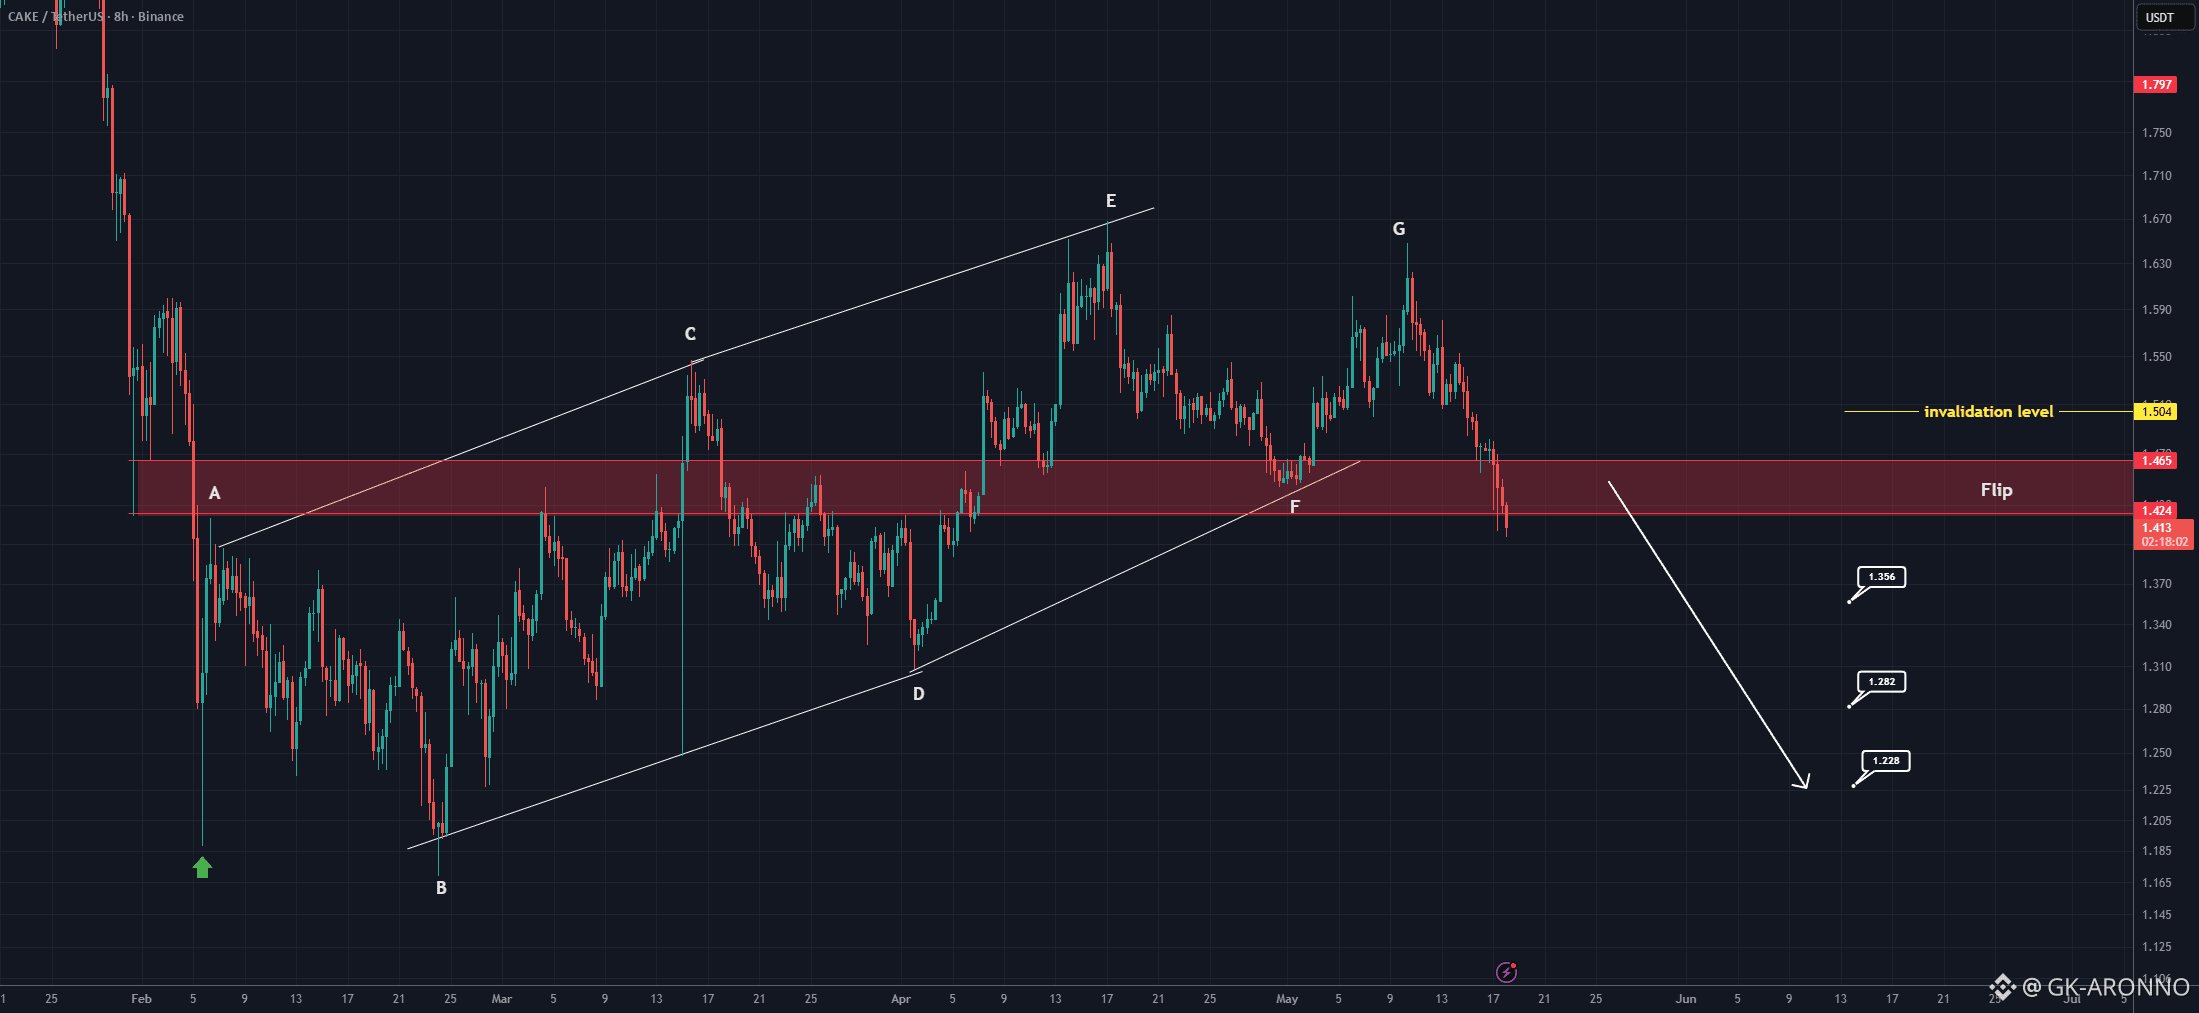
From the point where we placed the green arrow on the chart, it appears that a bullish diametric pattern has formed on PancakeSwap, and this diametric has recently been completed.
We have a red flip zone marked on the chart which has now been lost. With the loss of this zone, we expect the price to experience a deeper drop. If a higher degree pattern similar to this diametric has formed on PancakeSwap, we could witness a strong price and time correction on this asset.
Enter the position using DCA within the red zone or wait for a trigger confirmation.
The targets are marked on the chart. Move your stop loss to breakeven after reaching the first target.
A daily candle close above the invalidation level will invalidate this analysis.
If you have a coin or altcoin you want analyzed, first hit the like button and then comment its name so I can review it for you.
Do you also think CAKE is bearish?
