
Mastering Candlestick Charts: The Foundation of Technical Analysis
Candlestick charts are one of the most powerful tools used by traders to analyze financial markets, including cryptocurrencies, stocks, forex, and commodities. Developed by Japanese rice traders centuries ago, candlestick analysis remains a key component of modern technical trading. For anyone beginning their trading journey, learning how to read and interpret candlesticks is an essential skill.
What Is a Candlestick?
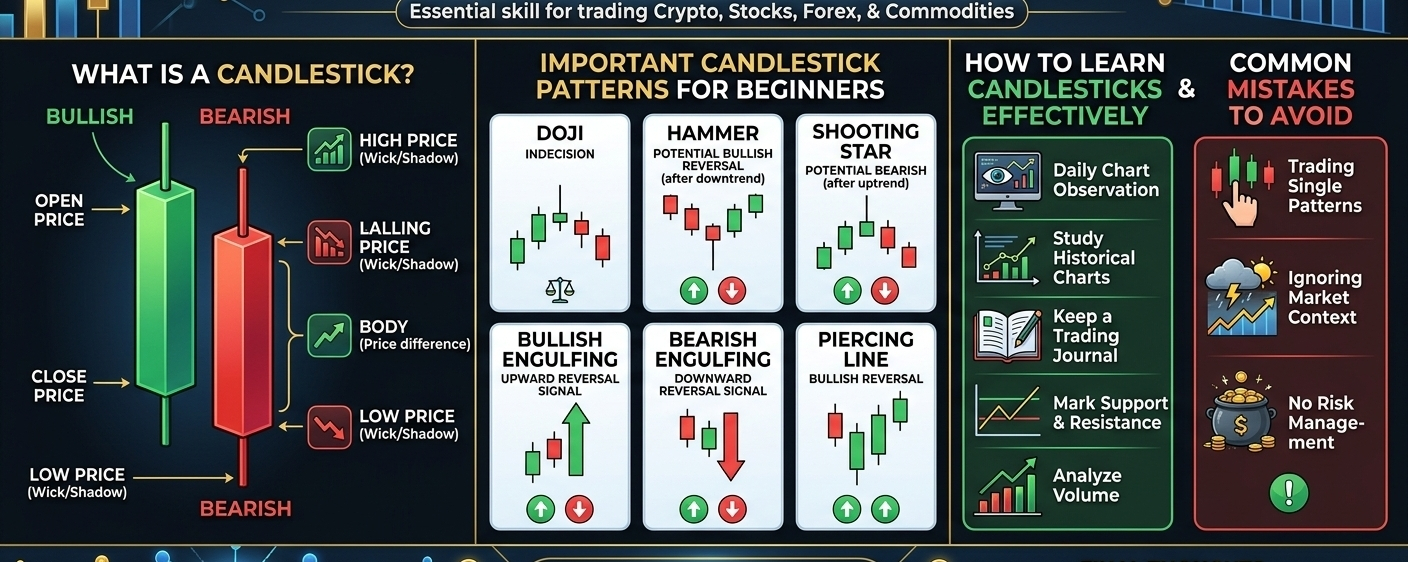
A candlestick represents price movement during a specific time period. Each candle contains four important pieces of information:
Open Price – The price at which the asset started trading during the selected period.
High Price – The highest price reached.
Low Price – The lowest price reached.
Close Price – The final price at the end of the period.
The body of the candle shows the difference between the opening and closing prices, while the wicks (or shadows) show the highest and lowest prices reached during that period.
Why Candlestick Charts Matter
Candlesticks provide more information than a simple line chart. They help traders understand the battle between buyers and sellers. By analyzing candle shapes and patterns, traders can identify potential trend reversals, continuations, and areas of market strength or weakness.
Important Candlestick Patterns for Beginners
1. Doji
A Doji forms when the opening and closing prices are very close or equal. It indicates market indecision and often appears before a significant price move.
2. Hammer
A Hammer has a small body and a long lower wick. It usually appears after a downtrend and may signal a bullish reversal.
3. Shooting Star
The opposite of a Hammer, a Shooting Star appears after an uptrend and can indicate potential bearish pressure.
4. Bullish Engulfing
This pattern occurs when a large bullish candle completely covers the previous bearish candle. It often signals a potential upward reversal.
5. Bearish Engulfing
A large bearish candle fully engulfs the previous bullish candle, suggesting that sellers may be taking control.
How to Learn Candlesticks Effectively
The best way to learn candlestick analysis is through regular chart observation and practice. Open cryptocurrency charts daily and try to identify patterns in real market conditions. Focus on understanding the story behind each candle rather than memorizing patterns.
You can also:
Study historical charts.
Keep a trading journal.
Mark support and resistance levels.
Analyze volume alongside candlestick patterns.
Backtest your observations on past market data.
Common Mistakes to Avoid
Many beginners make the mistake of trading solely based on a single candlestick pattern. No pattern is 100% accurate. Candlestick signals become more reliable when combined with trend analysis, support and resistance zones, volume, and proper risk management.
Another common mistake is ignoring market context. A bullish pattern appearing in a strong downtrend may not produce the expected result. Always consider the bigger picture.
Final Thoughts
Candlestick charts are a window into market psychology. They reveal how buyers and sellers interact and help traders make more informed decisions. While mastering candlestick analysis takes time, consistent practice and disciplined learning can significantly improve trading skills.
Remember, successful trading is not about predicting every market move. It is about understanding probabilities, managing risk, and making decisions based on evidence rather than emotions. By learning candlestick charts properly, you build a strong foundation for your future trading journey. $OPEN