📈 Bitcoin (BTC) Logarithmic Chart Discussion
The Bitcoin logarithmic chart tells a story that many traders miss when focusing only on short-term price action.
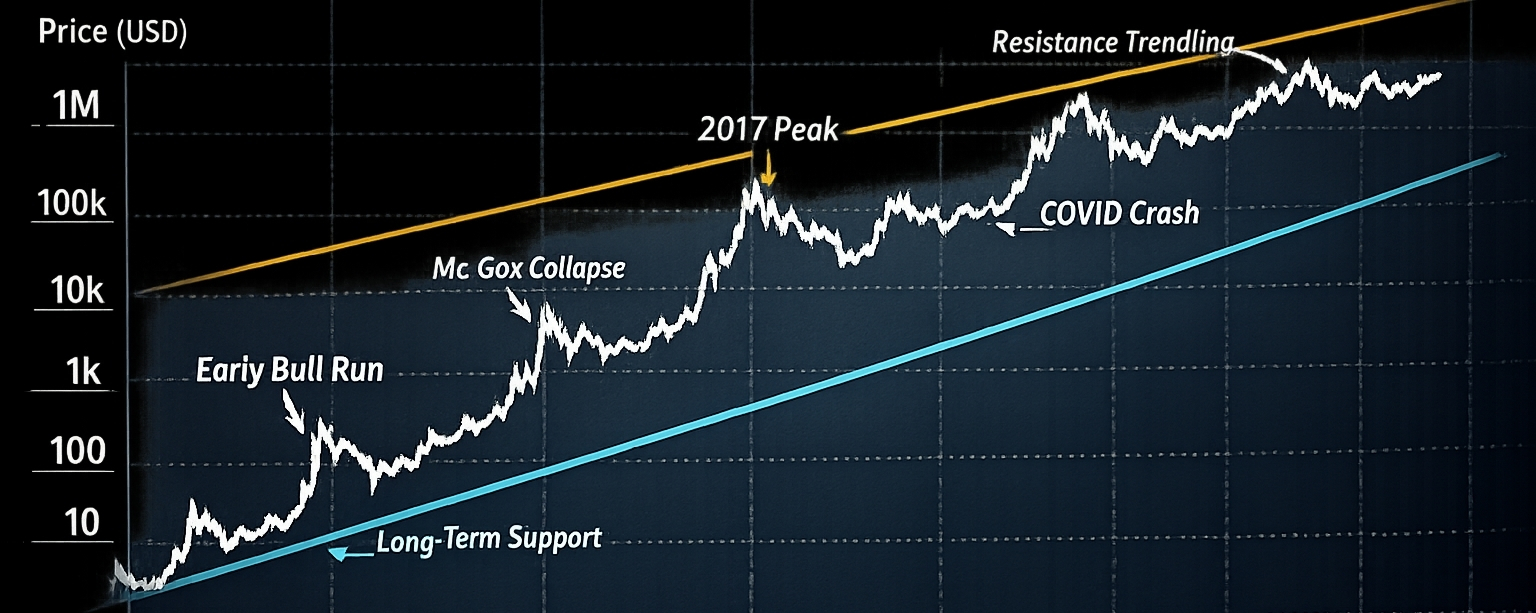
🔹 Why the Log Chart Matters A logarithmic chart measures percentage growth rather than absolute price changes, making it ideal for analyzing Bitcoin's long-term trend.
🔹 Key Takeaways
Every major bull run has been followed by a significant correction.
Despite multiple crashes, Bitcoin has continued to create higher highs over the long term.
Long-term support remains intact, showing the strength of Bitcoin's macro trend.
Market fear is temporary, but trends can last for years.
🔹 Trader's Insight Most traders lose focus by watching small timeframes. The log chart reminds us to look at the bigger picture and stay disciplined.
“Short-term volatility creates noise. Long-term trends create wealth.”
🚀 Are you trading every candle, or investing in the long-term trend?
#Bitcoin #BTC #Crypto #BinanceSquare #Trading #Investing #BullRun #HODL #cryptouniverseofficial ryptoMarket$BTC
