The market moves fast. Your emotions move faster. That's not a motivational quote — it's the entire business model of every liquidity grab you've ever gotten caught in.
If there's one pattern that has cost retail traders more money than any other single setup, it's the bearish sell trap. Not a rug pull. Not an exchange hack. Just price doing exactly what it's designed to do: punishing impulsive decisions and rewarding patience.
Let's break down what's actually happening on the chart, because once you see it, you can't unsee it.
What a "Sell Trap" Actually Is
A sell trap isn't some conspiracy where "they" are watching your specific stop loss. It's much simpler and more mechanical than that.
Markets move from one pool of resting liquidity to the next. Stop losses, breakout orders, and liquidation levels all cluster in predictable places — usually just above old highs and just below old lows. Big players need that liquidity to fill their large positions without massive slippage, so price gets engineered toward those pools before it reverses.
The "trap" part is psychological. Retail sees a breakdown below support, panics, and sells into weakness — and that exact selling is what fuels the move back up.
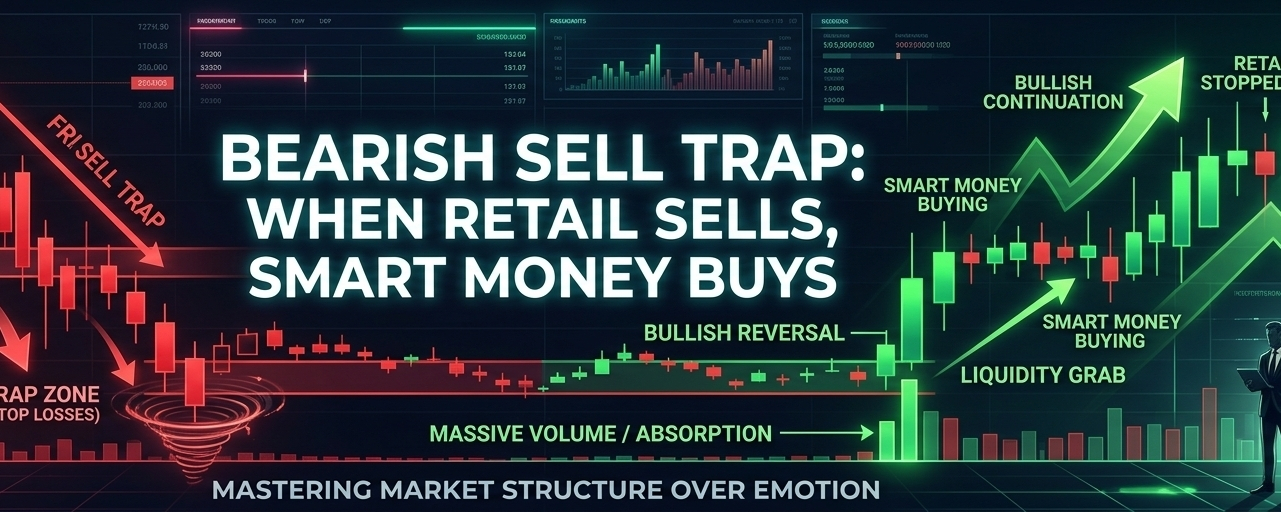
Breaking Down the Market Structure
If you look at how this sequence typically plays out on a chart, it follows a very specific anatomy:
1. The Real Zone (Top of the Range)
This is the area with a strong volume profile and a clear Point of Control (POC) — meaning a lot of real trading activity and heavy orders happened here. This zone matters because heavy volume represents genuine supply and demand, not just a random price level.
2. The Fake Entry Confirmation
Price breaks down from the real zone and starts forming what looks like a clean bearish structure: lower highs, lower lows, and stacked red candles. This is the bait. Technically, it "confirms" a short entry, which is exactly why so many traders jump in.
3. The Fake Sell Zone
Here's the part that catches people. Price consolidates in a zone with weak volume underneath it. Retail traders see the breakdown, spot a small retracement back up, and pile into shorts, convinced the trend is continuing down. But that volume underneath is thin — there is no real conviction held here, only orders waiting to be triggered.
4. The Flush
Price keeps dipping toward the weak volume area at the bottom, sweeping out the last of the sellers and hitting stop losses below recent lows. This is the point of maximum pain. The candles look the worst, sentiment is at its lowest, and that's precisely why it's the bottom. Smart money doesn't sell into weakness; it accumulates into weakness.
5. Retail Stopped Out & Invalidated
As price reverses and climbs back through the fake sell zone, it invalidates every short position opened there. Stop losses on those shorts instantly become buy orders, adding fuel to the upward move. The same crowd that sold the bottom is now forced to buy back higher.
6. Real Entry Confirmation & Smart Sell
Price pushes back up into the real zone — the area with genuine volume and structure. This is where the actual distribution happens. The "smart sell" happens where informed money exits into the liquidity created by retail FOMO buying back in, completing the round trip.
> The Tale of Two Outcomes: "Don't sell here" vs. "Sell here" comes down to confirmation. A close back into the real zone with strength invalidates the bearish read. A clean break and hold below the real zone validates it. The difference isn't guesswork; it's waiting for the candle close.
Why This Repeats in Crypto Specifically
Crypto markets are highly prone to this layout due to unique structural reasons:
Thin Order Books on Mid/Low Caps: A relatively small amount of capital can manufacture a fakeout and distort the chart.
24/7 Illiquidity: Major moves often happen during low-liquidity hours (like late weekend trading) when fewer real participants are active to absorb the volatility.
Liquidation Cascades: Leverage turns ordinary stop-outs into avalanches. Once liquidations start firing, they create automatic momentum independent of "real" market value.
Amplified Sentiment: Social media amplifies fear and greed in real-time, making crowd behavior at key levels highly predictable.
How to Trade It (Without Becoming a Conspiracy Theorist)
Here are five practical takeaways to protect your capital:
1. Check Volume Profile, Not Just Price: A breakdown on thin volume is far less reliable than one that breaks through a heavy POC.
2. Wait for the Retest: The first break of structure is bait more often than not. The retest — seeing if the level holds or fails as flipped resistance — tells you the real story.
3. Respect Invalidation Levels: If your short gets stopped out at a defined invalidation point, accept the data. Don't re-enter the same trade in anger.
4. Anticipate the Liquidity: If "everyone" is shorting the exact same obvious breakdown, ask yourself who is on the other side of that trade and why they want those stops triggered.
5. Treat Extreme Sentiment as a Flag: Maximum panic on your timeline is statistically more often a setup for a reversal than a signal to chase the move.
The Real Lesson
This isn't really about candlestick patterns. It's about recognizing that price action at key levels is often a function of where liquidity is resting, not what the news headlines say. The traders who consistently survive aren't the ones with the most indicators — they're the ones who've trained themselves to stop reacting to the scariest-looking candle on the chart.
Structure over impulse. Every single time.
#MicronHitsRecordHigh #SpaceXLosesOver$600BInThreeDays #BinanceMarginToListXLMTradingPairs #SPCXFalls17.44%InPreMarketTo$148.34 #BinanceToList4BStocksUSDTPairs