Bitcoin (BTC) is currently hovering at $73,667.61 USD, up 1.92% in the last 24 hours, with a market cap of $1.47 trillion. This positions BTC about 41.6% below its all-time high of $126,080 reached on October 6, 2025. Over the past year, BTC has gained 25.9%, but the recent correction has wiped out much of the post-2025 gains, bringing it to levels not seen since late 2024.
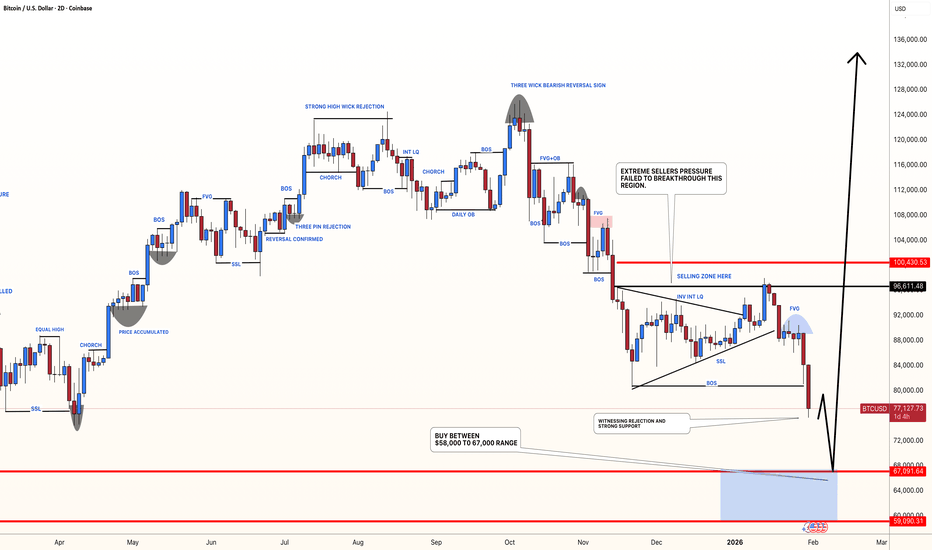
On the weekly timeframe, BTC is in a clear corrective phase after the parabolic run-up to ATH. The chart shows a descending channel, with price testing critical support around $72,000–$73,000, which coincides with prior swing lows and the lower bound of the channel. Resistance sits at $89,000–$90,000, where previous highs rejected advances. A hold above $72,000 could spark a relief rally toward $80,000, while a break lower might target $60,000–$70,000, aligning with the 200-week moving average.
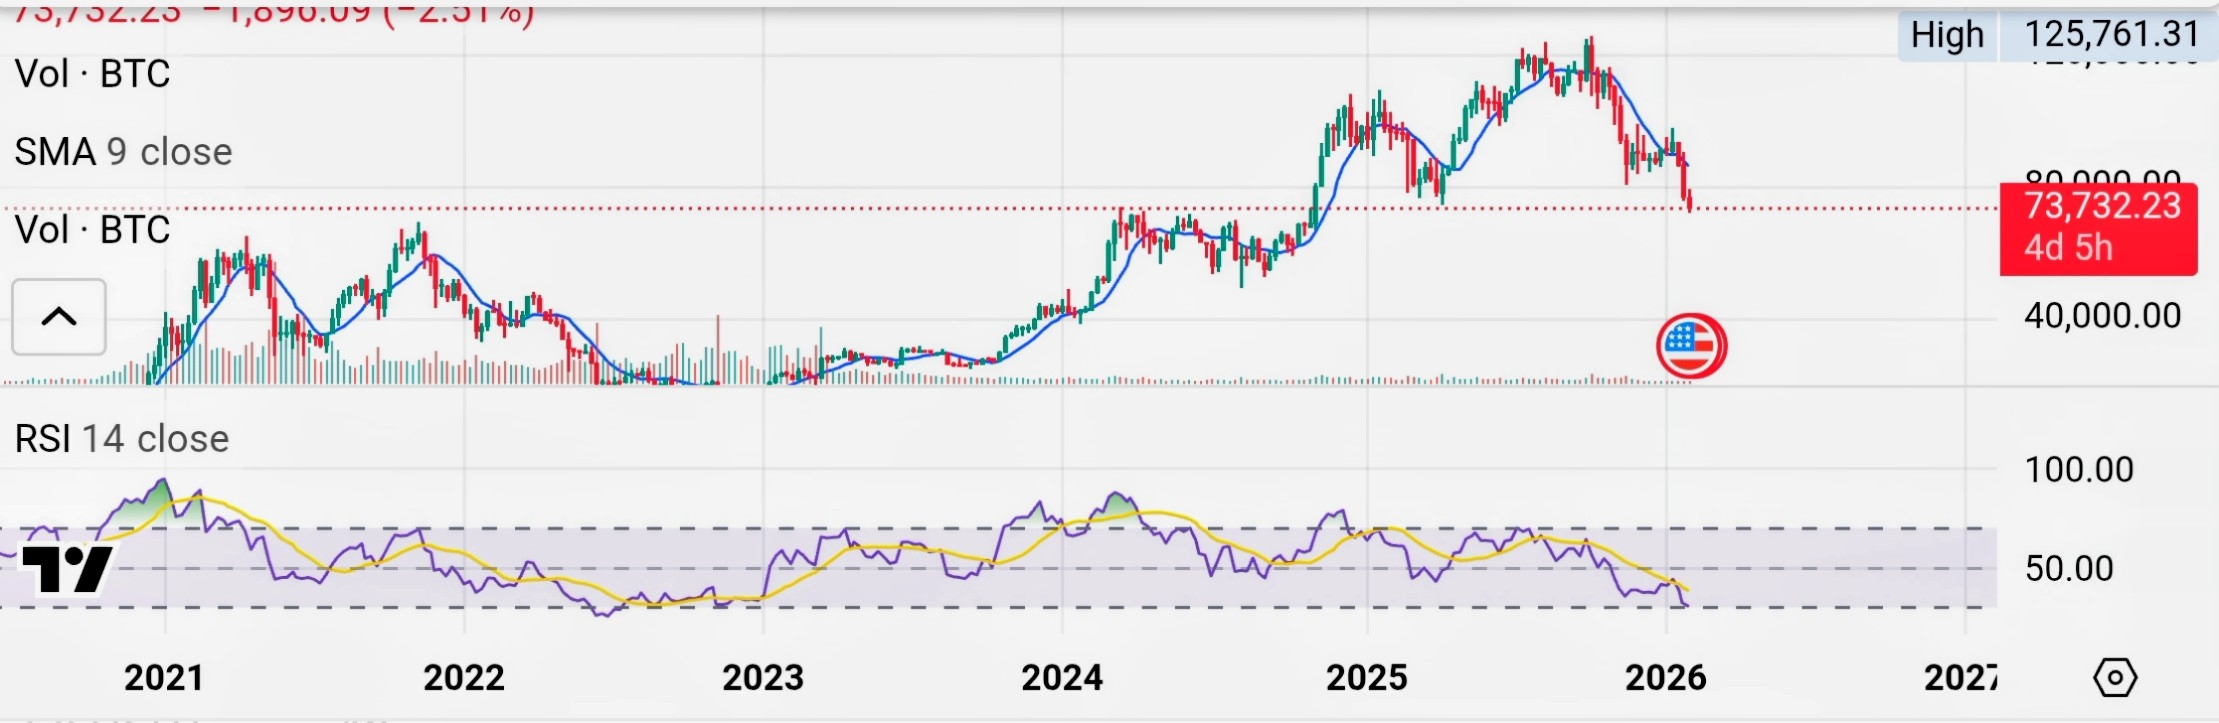
Technical indicators reinforce an oversold setup: The weekly RSI has dipped below 30, a level that historically precedes bounces, as seen in past cycles. The 50-week SMA is around $80,000, acting as overhead resistance, while the 200-week SMA provides long-term support near $50,000–$60,000. Recent weekly candles display bearish engulfing patterns and long upper wicks, indicating seller dominance, but volume is declining, often a sign of exhaustion. On-chain data shows steady hash rate and active addresses, suggesting network strength amid the dip.
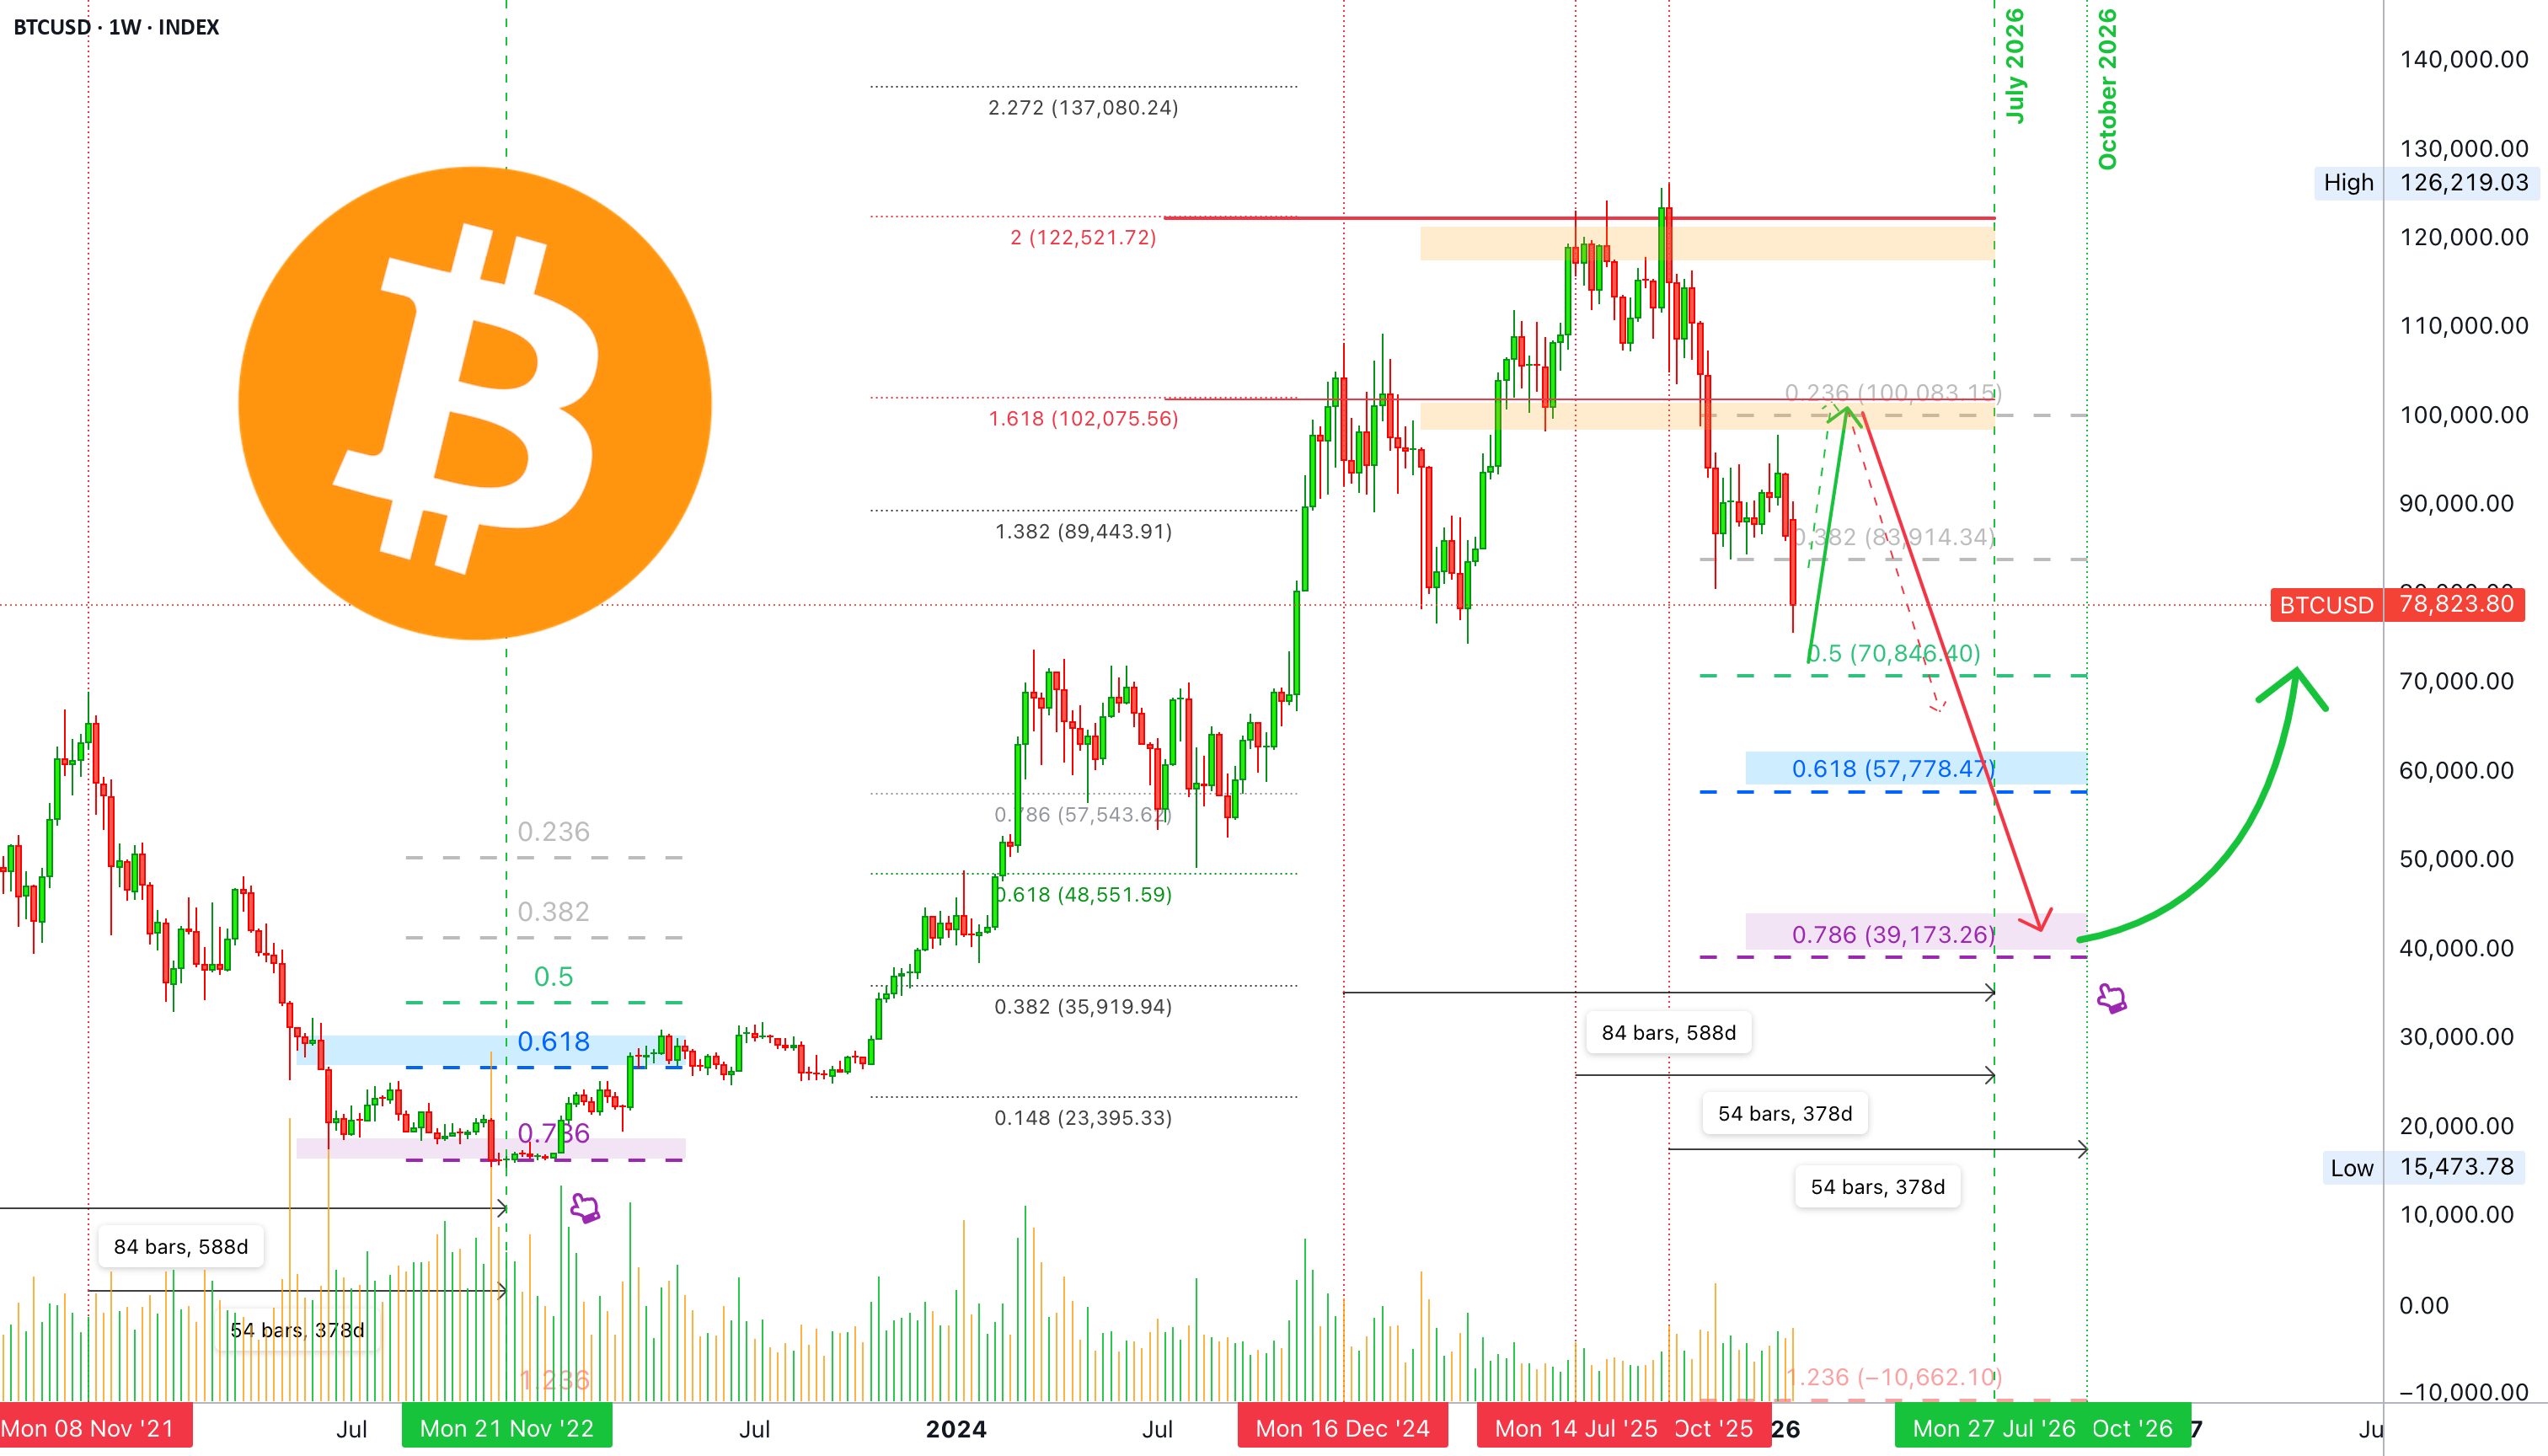
Mid-term, if the weekly close stays above $74,000, it could invalidate the bearish bias and eye $100,000 retest. However, persistent macro headwinds—like potential rate hikes or regulatory shifts—could push it to $38,000 in a deeper winter scenario, though that's extreme based on current metrics. Traders should monitor Stochastic crossovers for entry signals and use tight stops below support.
In essence, BTC's weekly chart screams oversold at $73K, hinting at a potential short-term bounce. Focus on risk management—scale in on dips, but watch for breakdowns. Stay vigilant with live data for precise trades.