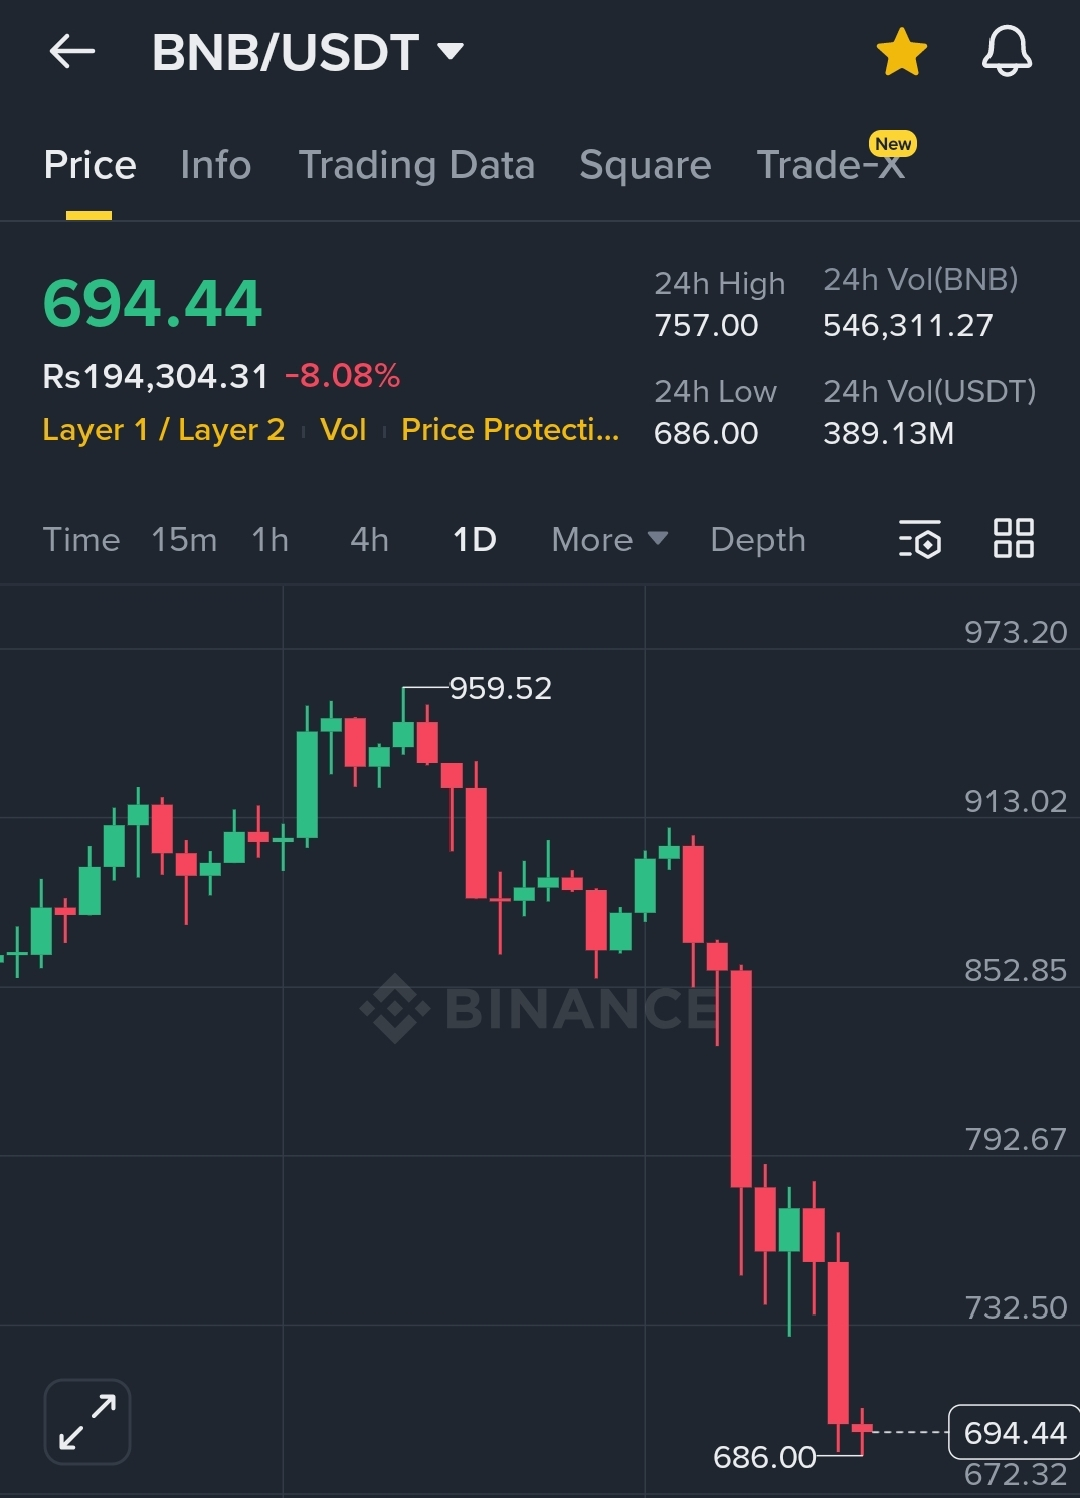
$BNB is currently testing a make-or-break support level. As of February 5, 2026, BNB/USDT is trading at $694.44, down 8.08% in the last 24 hours and hovering just above its 24-hour low of $686.00. This real-time analysis breaks down the key levels, momentum, and actionable strategy for what comes next.
📊 Live Market Snapshot & Interpretation

The provided chart and data reveal a market under intense selling pressure, but at a potential inflection point.
Why BNB is Bearish: The Technical Reality
The bearish structure is confirmed by the live chart. The primary reasons are:
1. Breakdown of Key Support: The price has decisively broken below the $711 - $697 support zone identified in prior analyses. This transforms that zone into new, strong resistance.
2. "Death Cross" Overhead: As discussed previously, the convergence of key moving averages near $880 creates a heavy ceiling for any recovery, far above current prices.
3. Sustained Downtrend: The price is making lower lows and is pressed against the lower Bollinger Band, a classic trend-following bearish signal.
🎯 Future Predictions & Key Price Levels
The immediate future hinges entirely on the $686.00 level.
Immediate Bearish Scenario (High Probability if $686 Breaks): A sustained 4-hour or daily close below $686 would likely trigger the next leg down. The primary target would be the $600 - $650 zone.
Bullish Reversal Scenario (Requires This Signal): For any significant bounce to occur, buyers must first defend $686 and then push the price back above $711 (previous support, now resistance). A close above $711 would be the first technical sign of seller exhaustion and could target a move toward $757 (the 24h high).
⚡ Actionable Strategy: When to Buy or Sell
For Active Traders:
DO NOT BUY HERE. Catching a falling knife is risky. Wait for a confirmed reversal signal.
Potential Buy Signal: Only consider a short-term long if the price holds above $686 and forms a clear bullish reversal pattern (like a hammer or bullish engulfing candle) on a 4-hour chart, with a target of $711. A stop-loss must be placed below $685.
· Sell/Short Signal: A break and close below $686 with rising volume is a confirmed sell signal. The logical trade is to short with a target near $650. A stop-loss can be placed just above $700.
For Long-Term Investors:
Pause Accumulation: The breakdown changes the game. The previous accumulation zone ($600-$750) is now in play from the top down.
New Accumulation Plan: If you are dollar-cost averaging, consider splitting your planned buys. Allocate a portion to the $650-$680 zone if reached, and hold the rest for a potential test of $600. Patience is key.
📌 The Bottom Line
$BNB is in a confirmed bearish trend and is testing critical support at $686. The path of least resistance remains down until proven otherwise. The optimal strategy is to wait for confirmation either a breakdown for a short opportunity or a strong reversal candle at support for a counter-trade bounce. The next 24-48 hours are crucial for setting the direction for the coming week.
 #ADPDataDisappoints #KevinWarshNominationBullOrBear #BNB_Market_Update #BNB