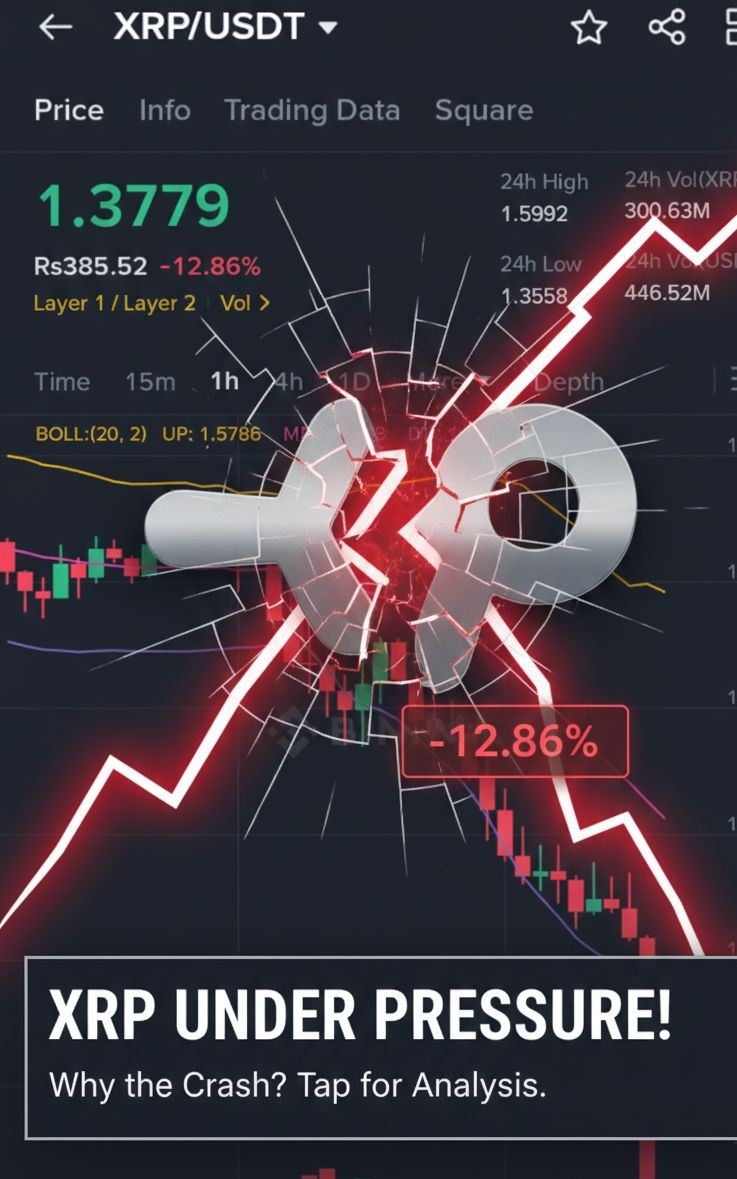
A partir de hoje, 5 de fevereiro de 2026, $XRP quebrou abaixo do nível de suporte crítico de $1,50, deslizando em direção a $1,37. Embora a comunidade permaneça forte, os gráficos contam uma história de um "reset estrutural."
1. O Efeito "Warsh" & Turbulência Macro
O mercado de criptomoedas mais amplo está se recuperando da indicação de Kevin Warsh como o novo presidente do Fed.
Dinheiro Difícil Pivot: Os mercados estão precificando uma mudança em direção à política monetária "mais rígida" (menos cortes na taxa de juros).
Dólar Mais Forte: Um índice do dólar dos EUA (DXY) em alta está colocando uma pressão pesada sobre ativos de risco como $XRP e Bitcoin ($BTC ).
2. A Grande Limpeza de Alavancagem
Olhando para o gráfico, as "velas vermelhas" acentuadas indicam uma cascata de liquidação.
Os traders que estavam apostando em uma recuperação para $2,00 foram forçados a sair de suas posições à medida que o preço atingiu as ordens de stop-loss.
O Interesse Aberto (OI) atingiu mínimas de vários meses, significando que a "espuma" especulativa está sendo eliminada.
3. Quebra Técnica (Bandas de Bollinger)
XRP está abraçando a Banda Inferior (DN: 1,3629). Isso mostra um momento extremamente baixista.
Até que o XRP consiga retomar a Média Móvel de 20 dias (MB: 1,4708), o caminho de menor resistência permanece para baixo.
4. Fadiga Institucional
Apesar do lançamento dos ETFs de XRP no início deste ano, os influxos institucionais desaceleraram. Após a enorme alta para $3,65 em meados de 2025, muitos "baleias" ainda estão em modo de realização de lucros, e novos compradores estão esperando por um "fundamento" confirmado.
O Lado Positivo? 🔍
Apesar da queda de preço, os dados on-chain mostram que os endereços de carteira XRP estão realmente aumentando. Isso sugere que, enquanto os "turistas" estão vendendo em pânico, os detentores de longo prazo estão acumulando nesses níveis mais baixos.
Zona de Observação: $1,35 é o piso psicológico imediato. Se se mantiver, podemos ver um período de consolidação. Se quebrar, $1,20 é a próxima parada.
Qual é o seu movimento? Você está comprando esta queda ou esperando por $1,20? Deixe-me saber nos comentários! 👇
#TechnicalAnalysis #BinanceSquare