Over the past sessions, Bitcoin moving below the $70,000 level has become one of the most talked-about developments in the market.
Rather than treating this as a headline event, I wanted to look at how the daily chart is reacting to this level and what the broader sentiment shift appears to be.
This is a personal market observation based on current chart behavior.
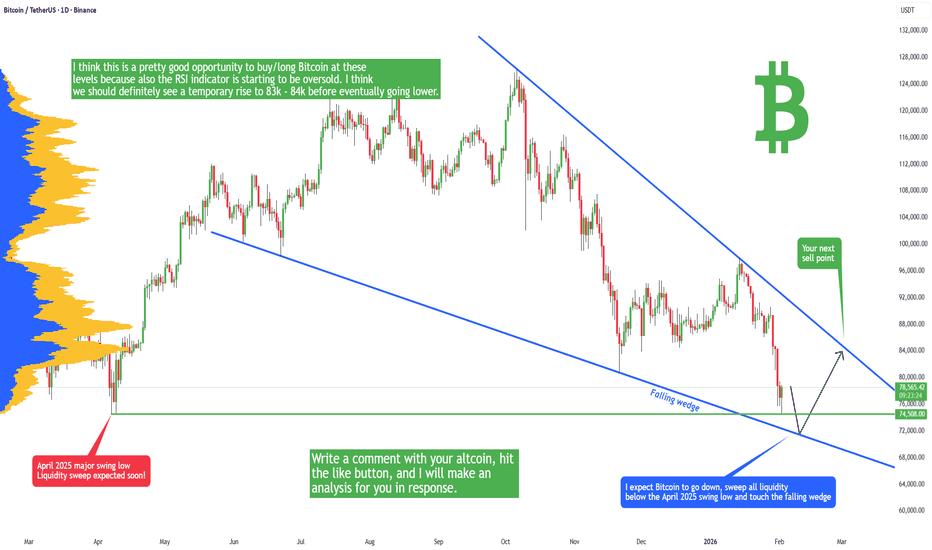
Bitcoin recently dropped below the $70,000 zone, a level that had held for months and became widely viewed as an important psychological and structural area.
The most notable part of this move is not the number itself — it’s the change in behavior after the break.
On the daily timeframe we can see:
Larger candles compared to prior weeks
Increased volatility
Stronger reactions to intraday moves
This type of shift often appears when the market moves from confidence → caution.
Institutional Flow & Long-Term Trend Signals:
Another important change in market discussions in recent times is observed in terms of a shift in institutional behavior.
Institutionally, the last cycle, the participation was viewed as one of the biggest supports for the price action of Bitcoin. Recently, the data from multiple platforms shared by analytics platforms indicated a weakened institutional participation compared to the last year.
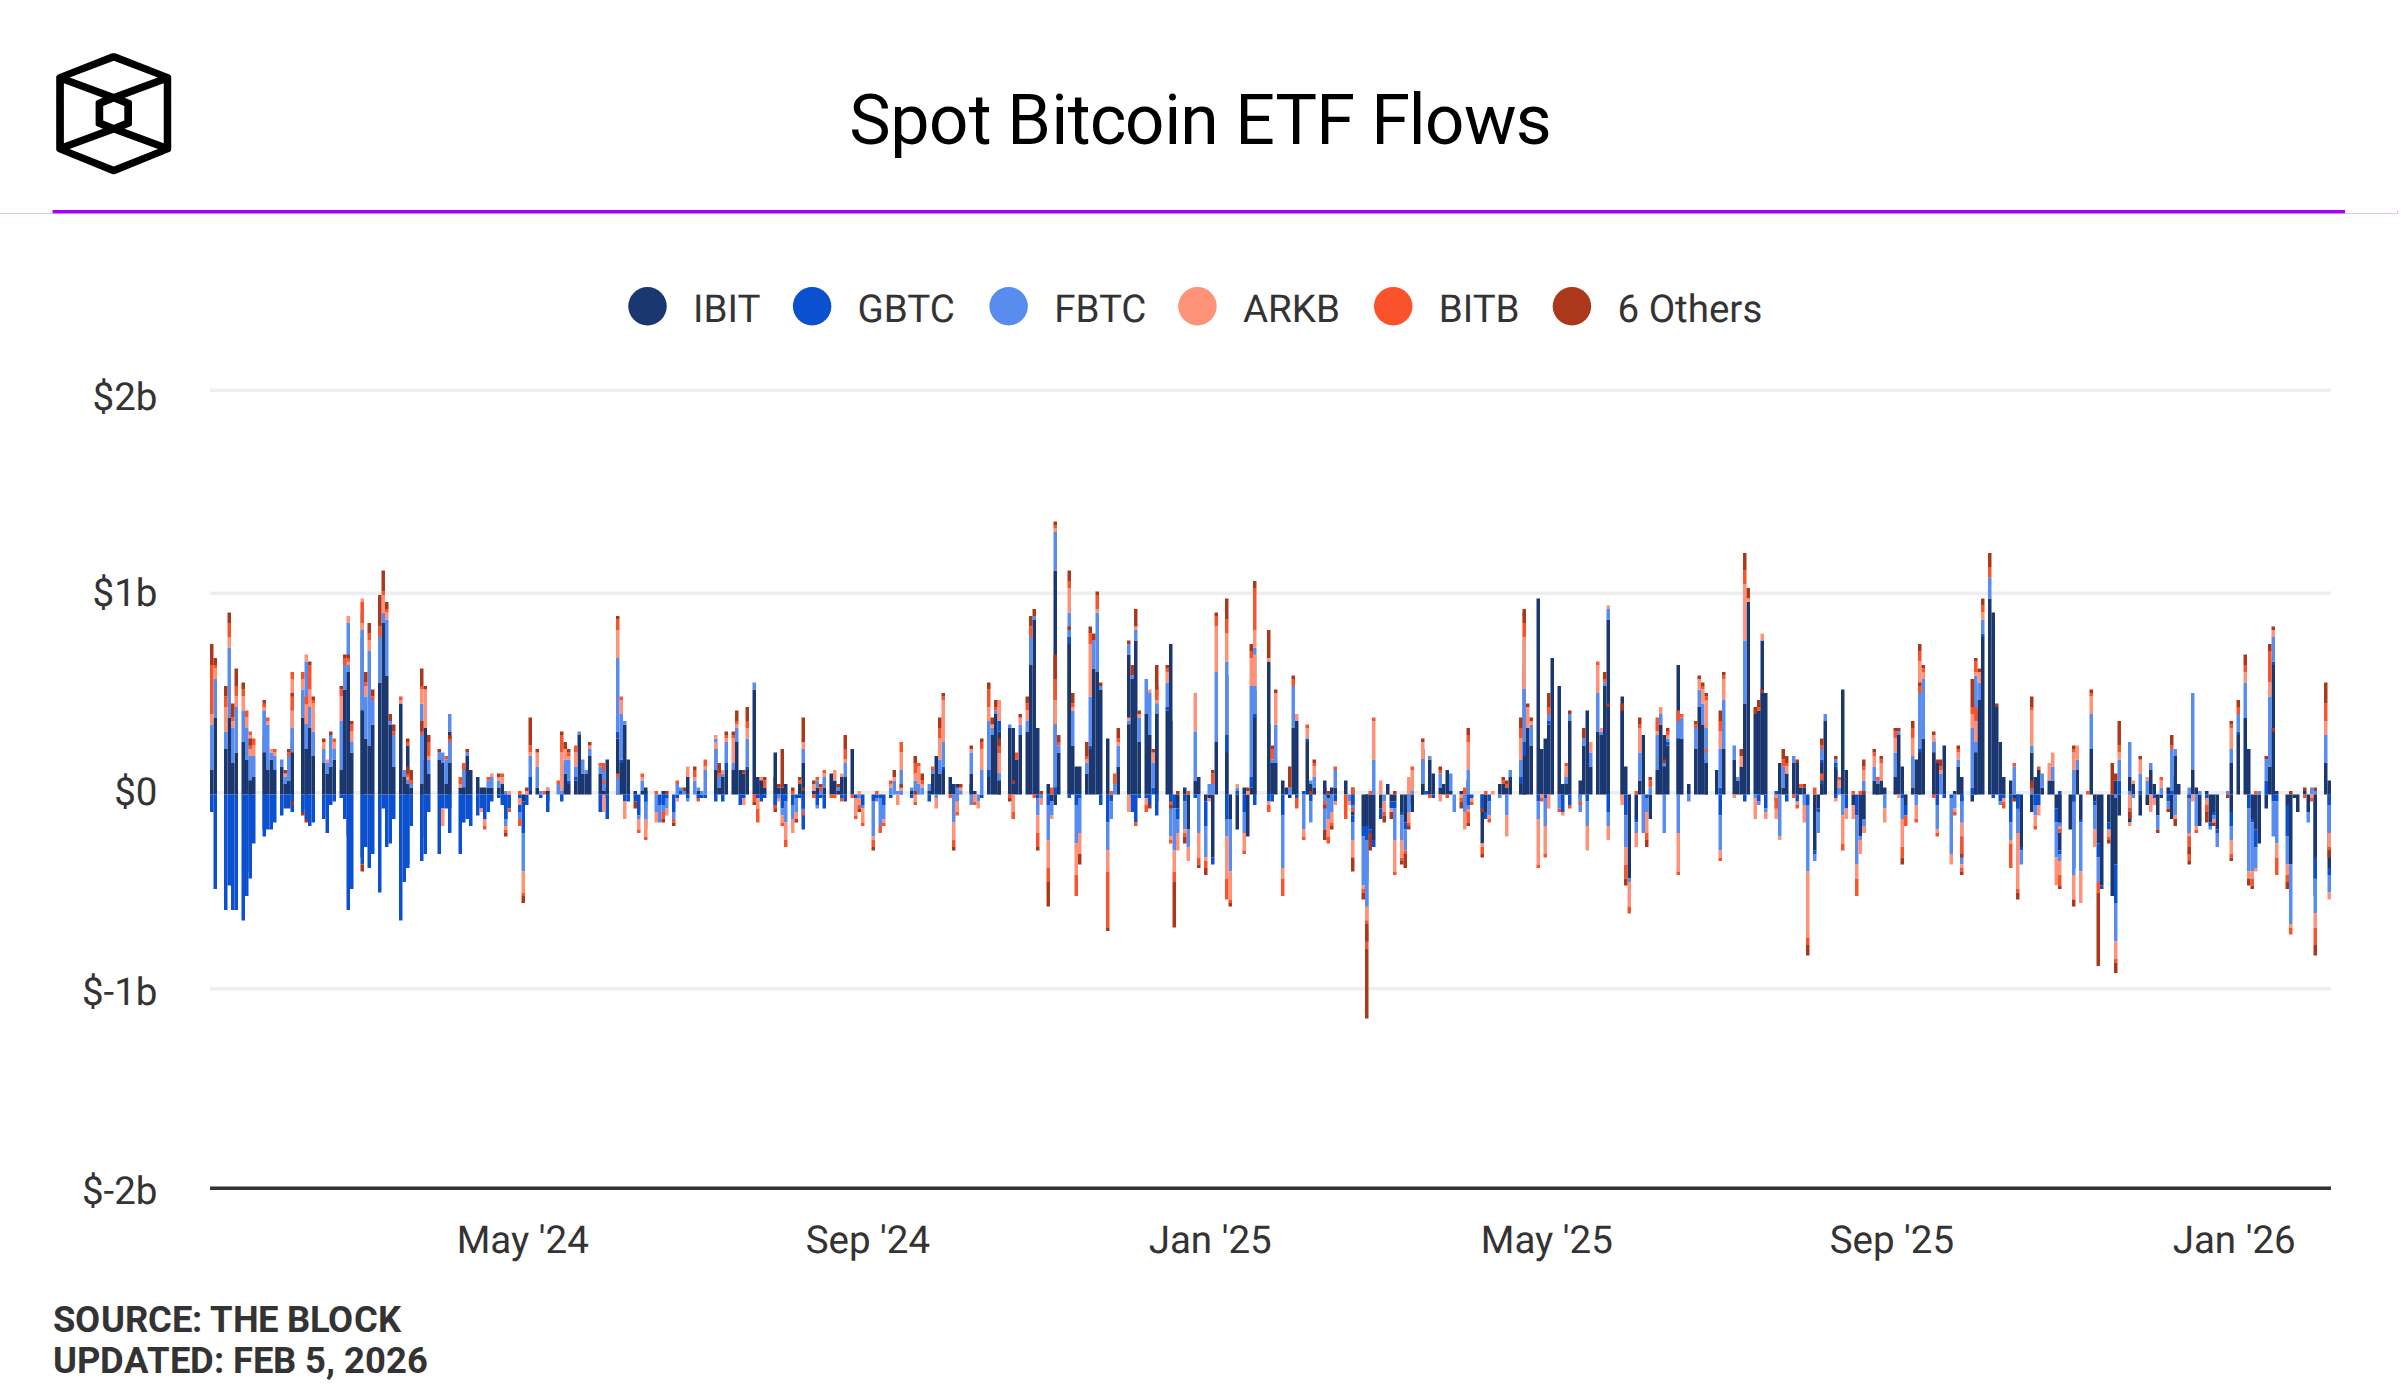
One of the prominent observations is the change related to the behavior of the U.S. dollar Bitcoin ETFs. Indeed, ETFs acted as significant demand for BTC at the same period last year. However, the latest flow has noticed some observations of net selling, which impacts the market’s short-run balance of market participants.
Long-Term Trend Indicator / 365 Day Moving Average:
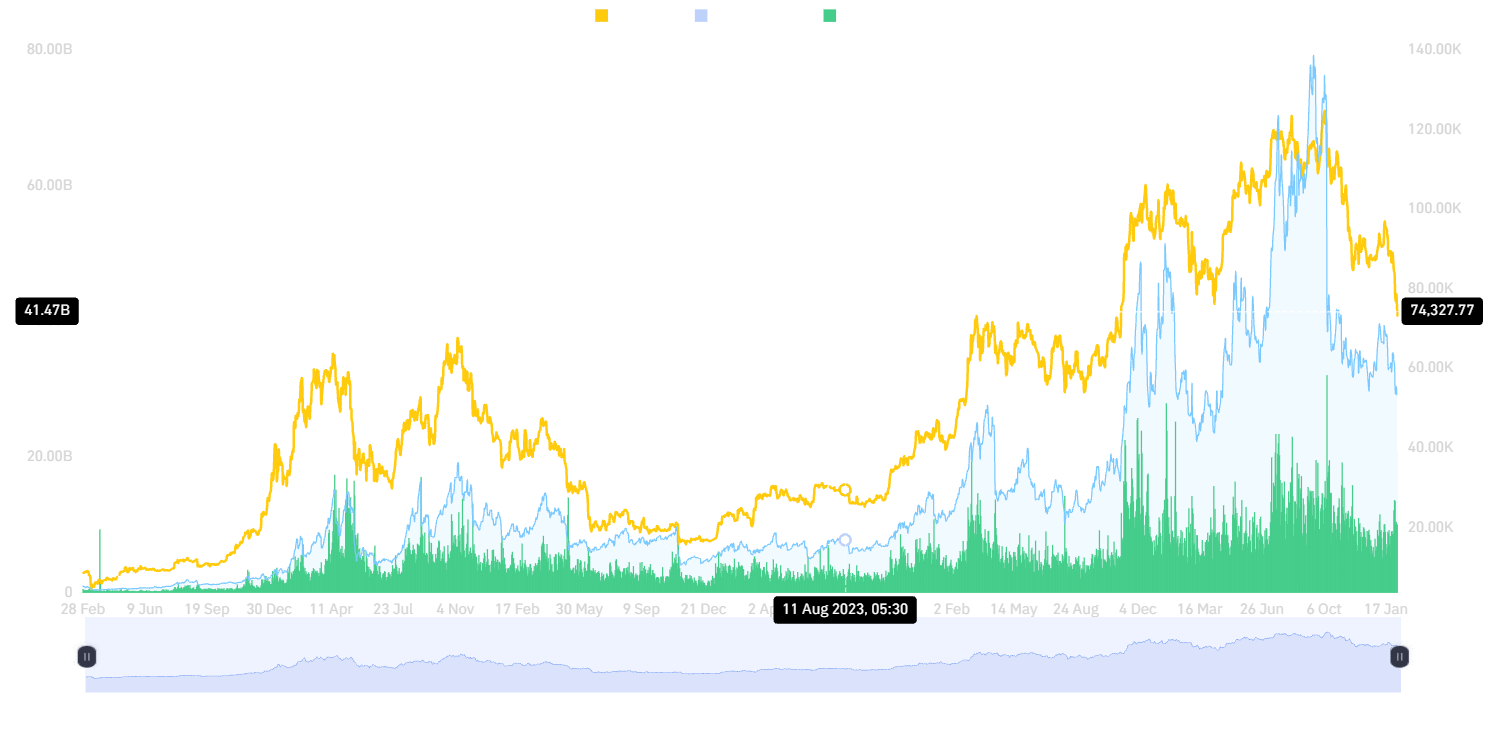
Another trend of note is that of Bitcoin sliding past its 365-day moving average.
This indicator can frequently be utilized to ‘smooth’ the volatility of short-term price movements, in addition to determining the direction of the trend moving forward. When the price rises above it, the trend in the market is usually in very good health; however, when the price falls below it, then this reflects a ‘re-evaluation period’.
Historically, movements away from or towards this long-term average tend to:
Slow momentum
Increase volatility
Shift Sentiment From Confident to Cautious
This does not determine future direction of price, but it does indicate that the market is evaluating its past trend.
What This Suggests About Current Market Behavior:
Putting these observations together:
Institutional participation appears less aggressive than last year
Long-term trend indicators are being tested
Volatility has increased across the daily timeframe
These conditions usually appear when markets transition from strong trend → uncertainty phase.
At this stage, the focus shifts from momentum to how price reacts around key long-term indicators.
Sentiment Shift: From Narrative to Liquidity:

Over the last year, Bitcoin had been widely discussed as:
A store of value
A hedge against inflation
A digital alternative to traditional safe havens
However, recent price action suggests that the market is currently treating Bitcoin more like a risk-sensitive asset, moving alongside broader market sentiment.
This does not invalidate long-term narratives, but it does show how short-term behavior can diverge from long-term expectations.
Volatility & Liquidations:
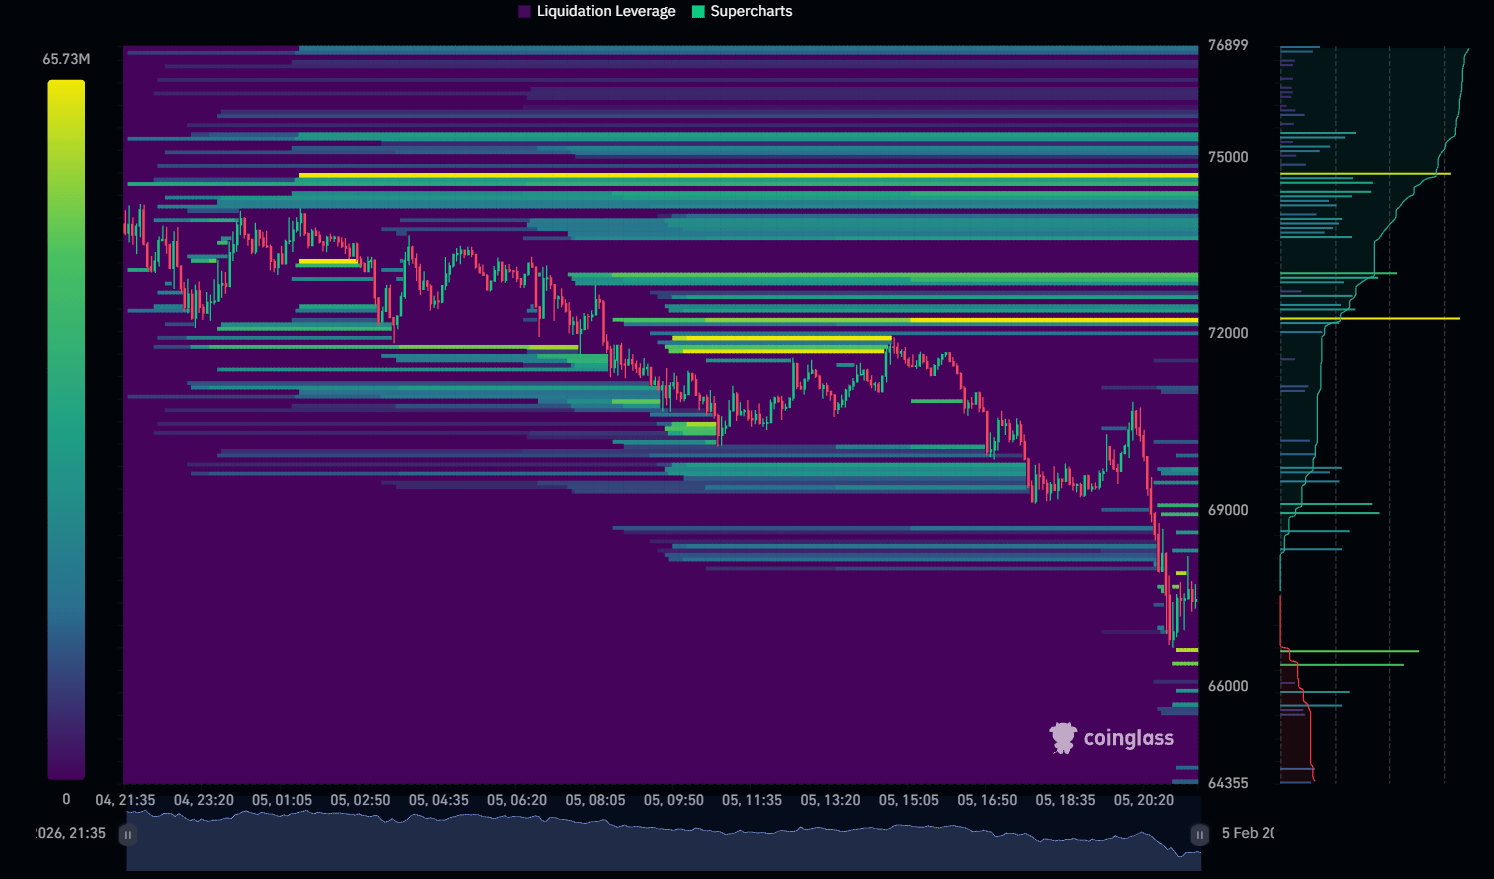
Another factor which has caused the decrease below the mark of $70K is the effect of forced liquidations.
When volatility increases,
“Leveraged positions get closed automatically”
Price movements are accelerated quickly
Sentiment can change quickly
Such events can cause large price movements that, although dramatic in the financial press, represent perfectly ordinary market cycles.
What the Market Appears to Be Processing......
As of now, the daily chart implies:
Confidence is under review
Participants are becoming more cautious
The prices are reflecting the overall risk sentiment
This doesn’t mean, of course, that this might be a permanent shift, but it certainly indicates a change in shorter-term behavior.
"Normally, the markets do not move in a straight line. Markets move in phases."
Does the break below $70K feel structural or temporary.....?
How much weight do you give psychological levels like this......?
What signals do you watch most on the daily timeframe......?