O mercado de criptomoedas está atualmente enfrentando uma queda significativa em 5 de fevereiro de 2026, principalmente devido a uma "tempestade perfeita" de incerteza macroeconômica e tensões geopolíticas.
Por que o Mercado Está em Baixa?
Mudança Macroeconômica: Um fator importante é a nomeação de Kevin Warsh para liderar o Federal Reserve dos EUA. Os investidores temem sua política de "dinheiro duro" e a possibilidade de reduzir o balanço do Fed, o que restringiria a liquidez e prejudicaria ativos "de risco" como as criptomoedas.
Sentimento de Aversão ao Risco: Escalações geopolíticas (particularmente no Oriente Médio) levaram os investidores a retirar capital de criptomoedas voláteis e a investir em refúgios seguros tradicionais como ouro e dinheiro.
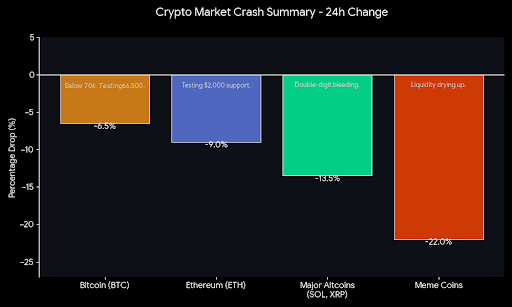
Armadilha de Liquidez: A liquidez do mercado encolhida, em parte causada por uma breve paralisação do governo dos EUA, amplificou as oscilações de preço. Com menos compradores, mesmo uma pressão de venda moderada causou uma "cascata de liquidação", eliminando bilhões em posições longas alavancadas.
Saídas de ETFs: Grandes investidores institucionais têm retirado fundos dos ETFs de Bitcoin e Ethereum, removendo um pilar chave de suporte que sustentou os preços no início do ano.
Comparação de Mercado: Bitcoin vs. Altcoins
Historicamente, as altcoins são mais voláteis do que o Bitcoin. Quando o Bitcoin cai, as altcoins geralmente caem muito mais, à medida que os investidores buscam a segurança percebida do "líder do mercado."
Análise de Comparação de Mercado
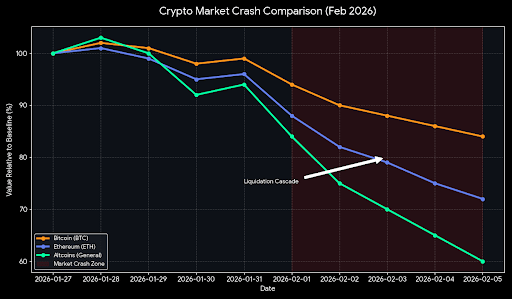
Como mostrado no gráfico, o colapso do mercado não afetou todas as moedas igualmente:
Bitcoin (BTC - Linha Laranja): O Bitcoin continua a ser o mais resiliente. Embora tenha caído significativamente (aproximadamente 16%), ele atua como o "porto seguro" do mundo cripto. Sua queda é acentuada, mas mantém sua estrutura melhor do que outros.
Ethereum (ETH - Linha Azul): Ethereum mostra maior sensibilidade. Ele caiu aproximadamente 28%. Como o Ethereum é a base de grande parte dos setores DeFi e NFT, uma queda na confiança do mercado leva a uma saída mais rápida do ETH do que do BTC.
Altcoins (Linha Verde): Esta categoria, representando projetos de menor capitalização e moedas de "hype", foi a mais afetada com uma queda de 40%. Durante um pânico no mercado, os investidores retiram seu dinheiro das altcoins de alto risco primeiro para proteger seu capital, levando ao efeito de "sangramento" visto no gráfico.
Gráfico de Comparação: BTC vs. ETH vs. Altcoins
Resumo da Queda
A "Cascata de Liquidação": A queda mais acentuada (notada no gráfico) ocorreu quando traders alavancados foram forçados a vender suas posições automaticamente à medida que os preços atingiam suas ordens de stop-loss, criando um efeito dominó.
Mudança de Dominância: Durante este colapso, a Dominância do Bitcoin geralmente aumenta. Isso significa que, mesmo que o BTC esteja caindo, está perdendo menos valor do que o resto do mercado, causando um aumento em sua participação do valor total de mercado.