Have you seen these numbers? While most are panicking, the "smart money" has already hit the red button—and the data in my screenshots proves it.
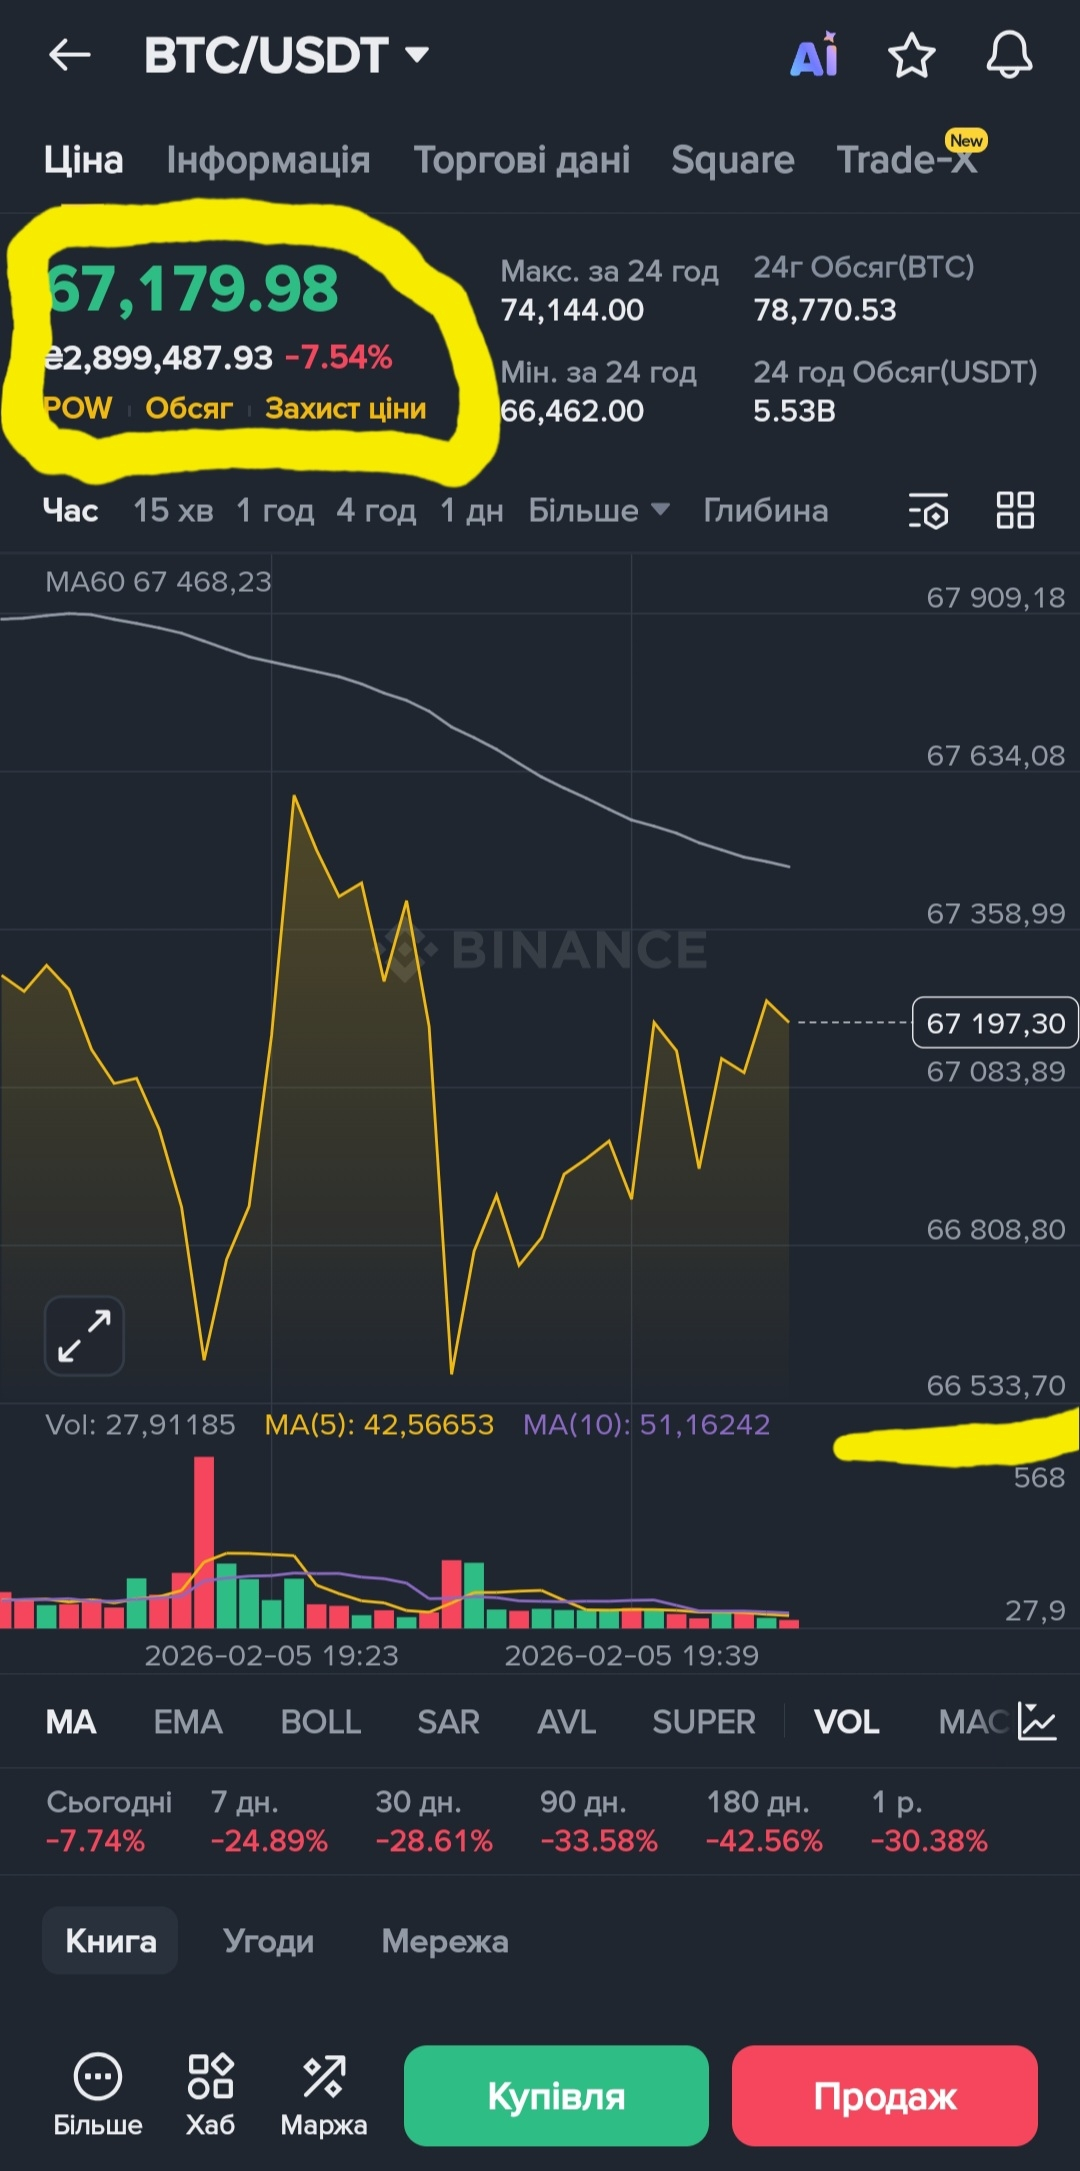
While the crowd is staring at red candles in fear, let's open the charts and find the truth. As of February 5, 2026, Bitcoin is facing one of its most dramatic moments this year.
What do the numbers REALLY say? (Check the screenshots 📸):
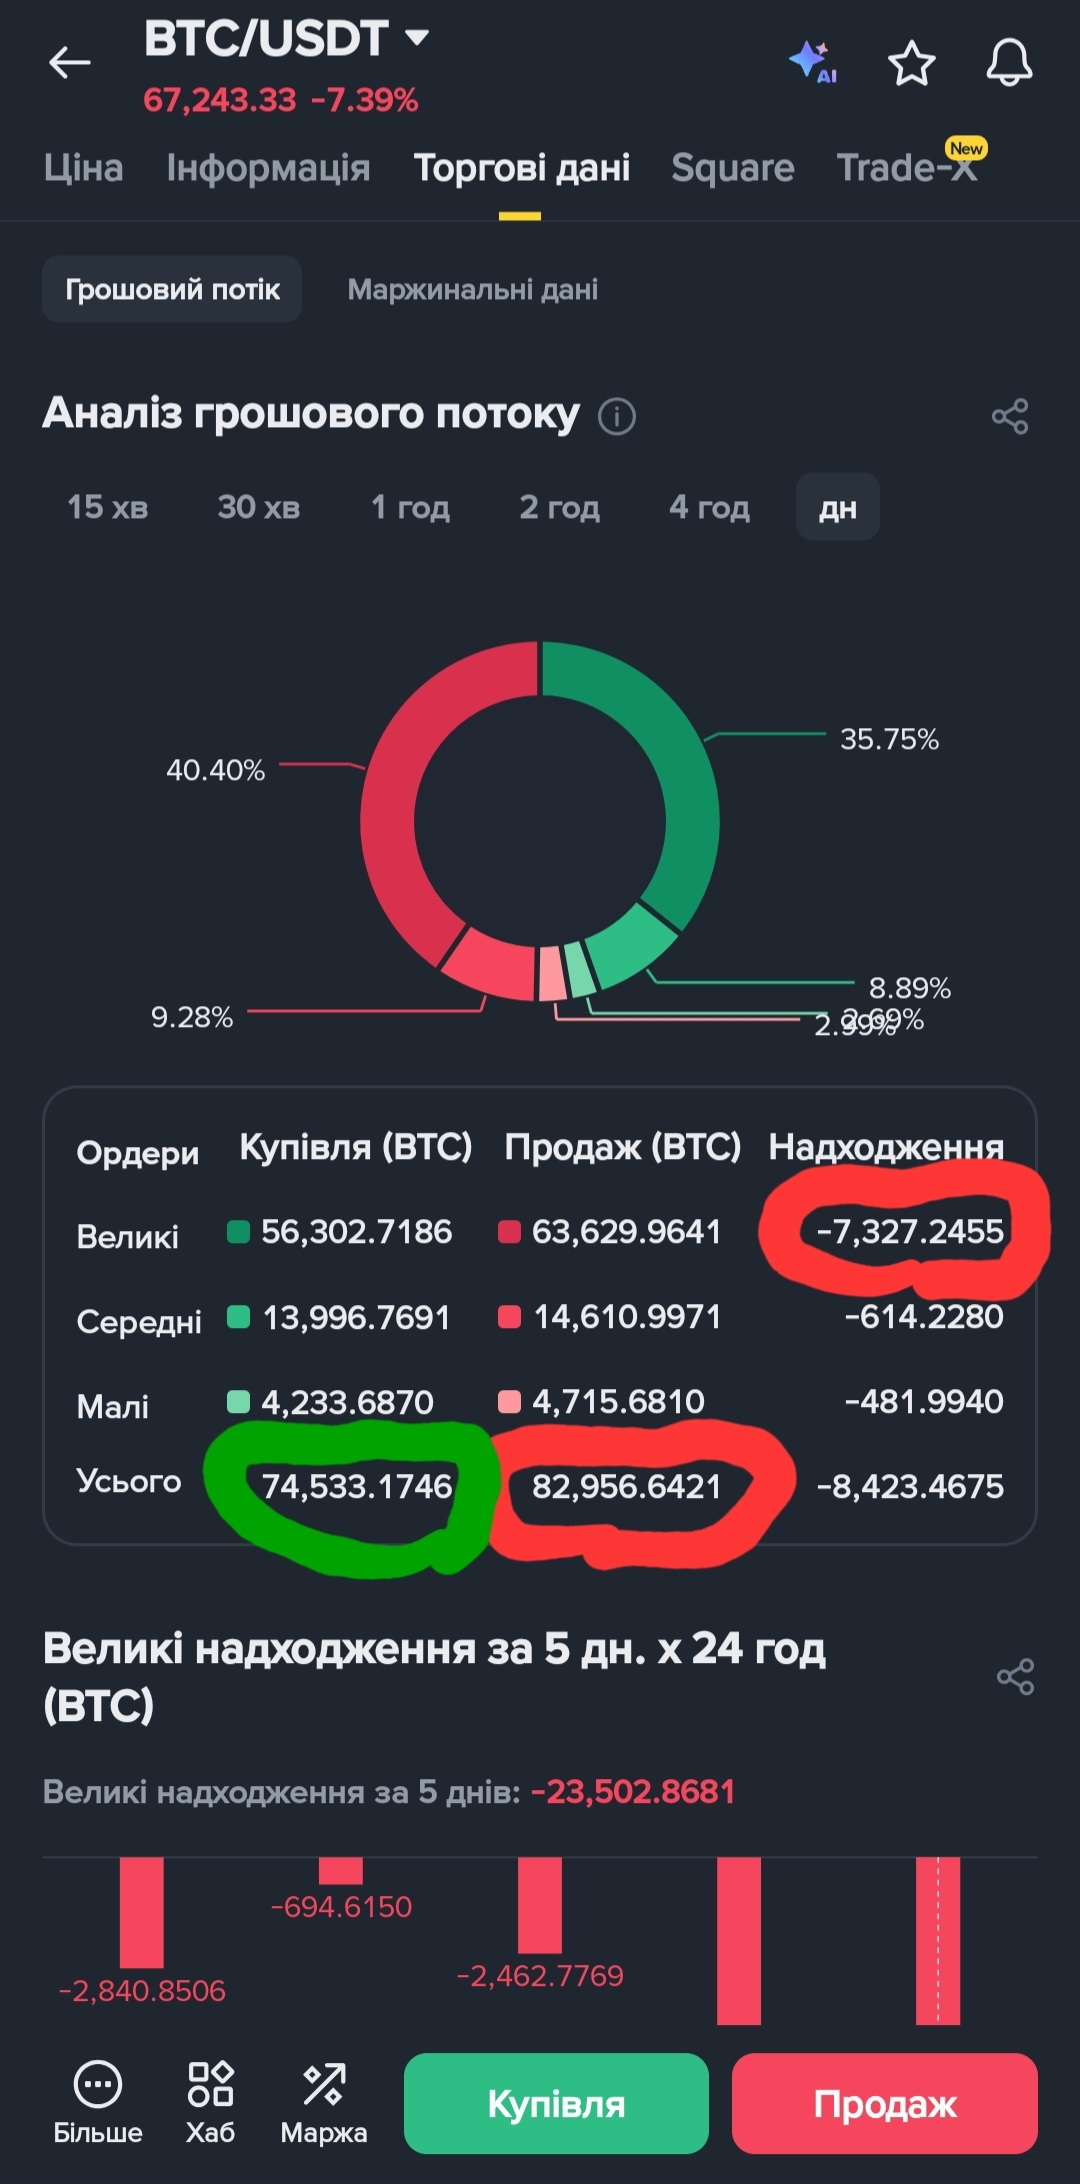
The charts clearly show capitulation: price at $67,250, down -7.5%. But the devil is in the details—look at the Money Flow:
Whale Outflow: Over -7,327 BTC moved in 24 hours. In the last 5 days, more than 23,500 BTC has left the market. Large players are either locking in profits or intentionally triggering panic to buy back much lower.
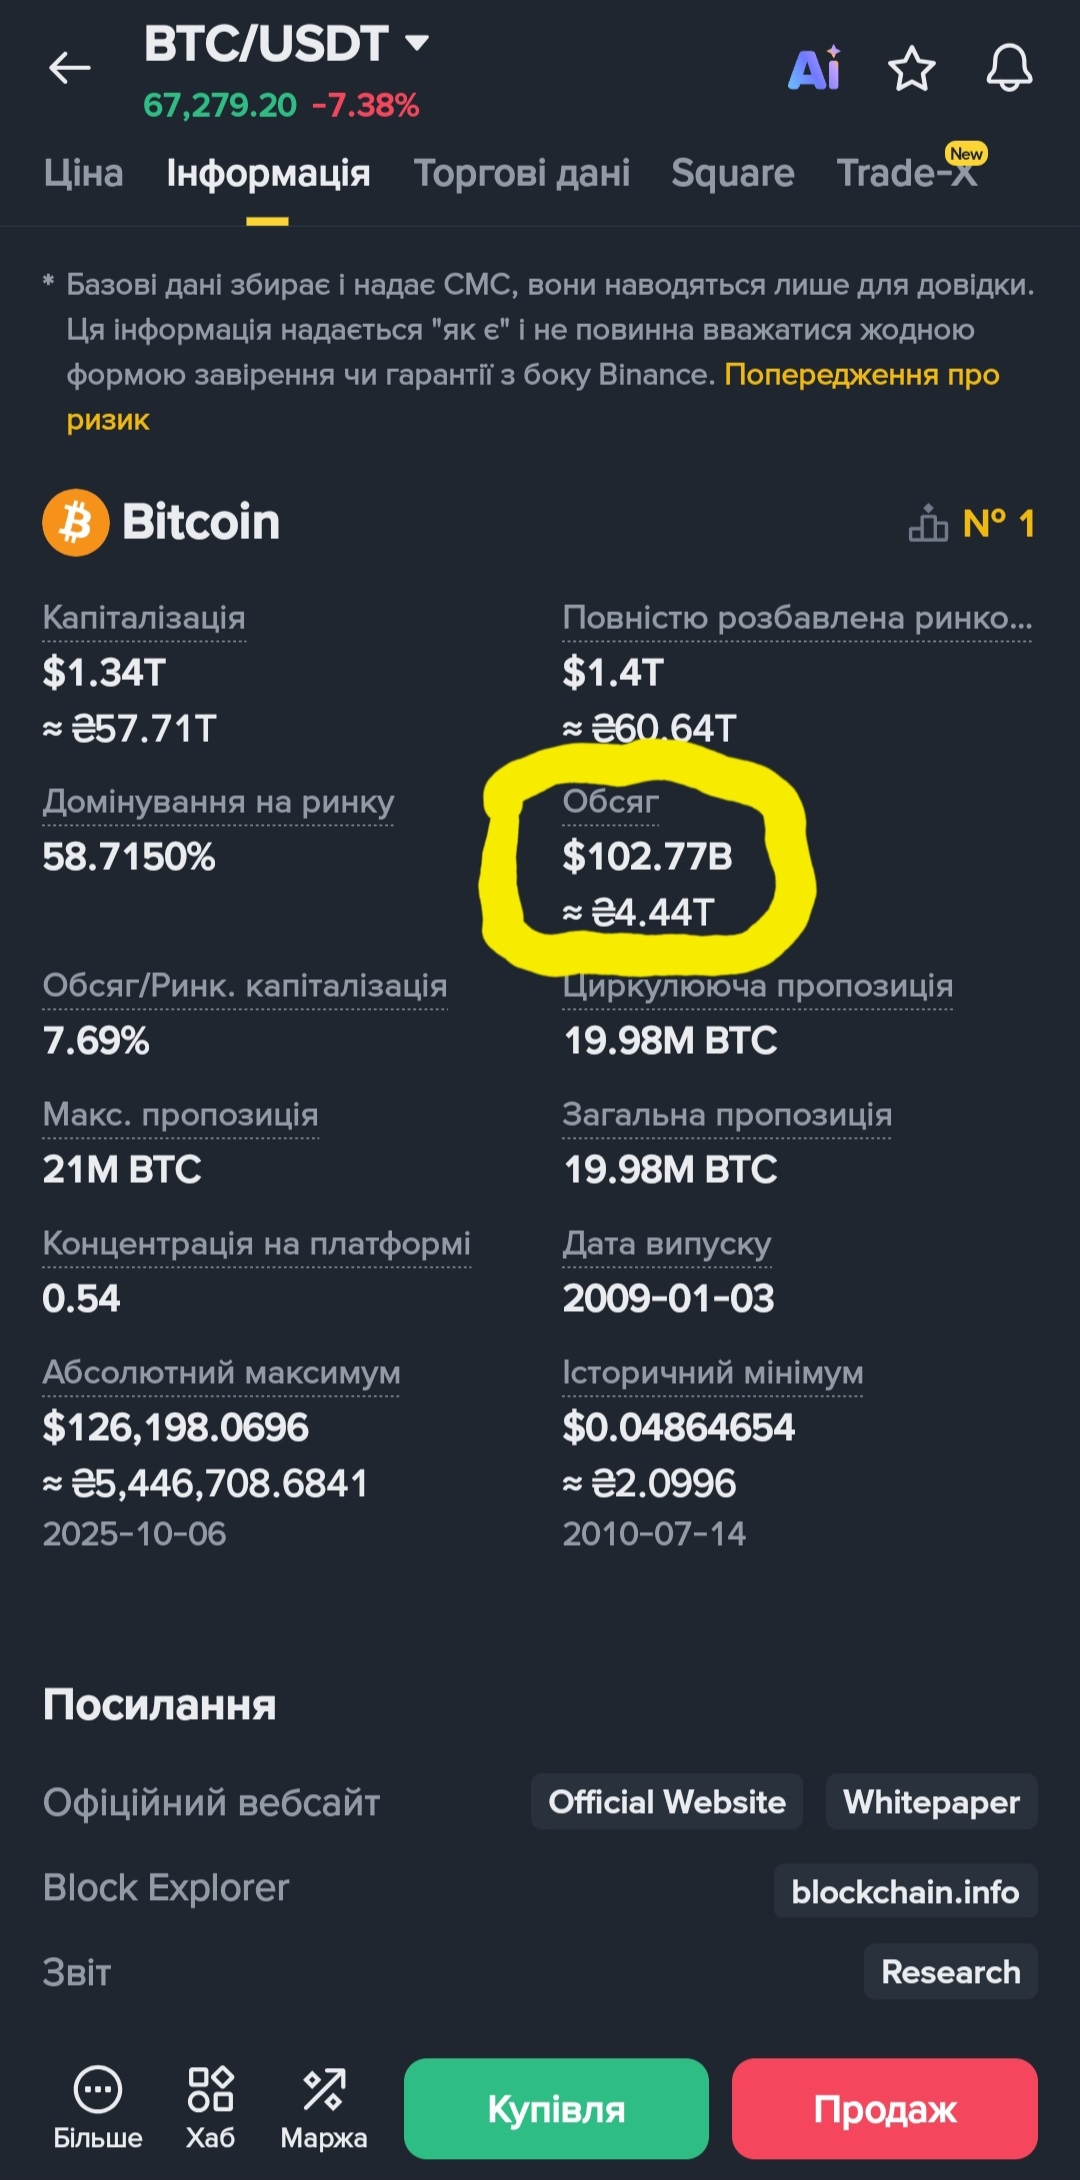
Volume Battle: Over $102.6B in daily volume—the market is incredibly alive! However, we see a clear imbalance: 82,956 BTC in sell orders vs. 74,533 BTC in buy orders. The bears are pushing hard, and this pressure cannot be ignored.
🔍 Two Scenarios — One Choice:
The Bear Case (Panic Sell): 🐻
Losing the psychological $70,000 level opens the door to the support zone at $64,000 – $58,000. If this selling pressure doesn't cool off, we might see a "long summer" in red.
The Bull Case (The Dip Opportunity): 🐂
RSI is already in the oversold territory, and "smart money" usually buys when the Fear & Greed Index hits extreme levels. This could be a global "flush" of over-leveraged long positions before a final run toward $100,000+.
💡 My Strategy:
I don’t recommend "catching a falling knife," but a Grid Trading setup in the $62k–$68k range looks like a mathematically justified risk for long-term players.
What’s your move right now?
👍 — Buying the dip, it's a discount!
🔥 — Waiting for $60k to enter safely.
🤔 — Watching from the sidelines, too risky.
Drop your entry price in the comments! I’ll break down the most interesting predictions in my next post. 👇
#bitcoin $BTC #CryptoAnalysis" #BinanceSquare #MarketUpdate #tradingStrategy