Beginner-Friendly Guide: draw cleaner levels, avoid common mistakes, and use them with a simple trading plan.
What you will learn
In one sitting, you will learn how to identify high quality support and resistance zones, why zones matter more than precise lines, and how to turn levels into a simple bounce or break plan.
Support and resistance, simply explained
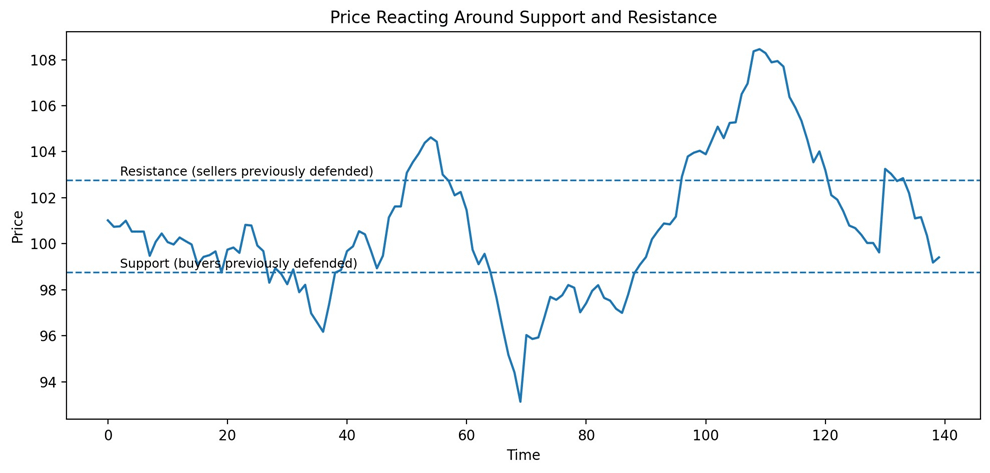
Support and resistance are the two most practical ideas in technical analysis because they describe how markets actually behave: price repeatedly reacts at certain areas where buyers or sellers showed up before. You do not need complex indicators to use them. In fact, the cleaner your chart, the easier it is to see what matters.
Think of price as an auction. When price falls into an area that previously attracted strong buying, participants remember it as “cheap enough” and demand tends to return. That area is support. When price rises into an area that previously attracted strong selling, participants remember it as “expensive enough” and supply tends to return. These reactions are not magic. They happen because positions, emotions, and orders cluster around obvious levels.
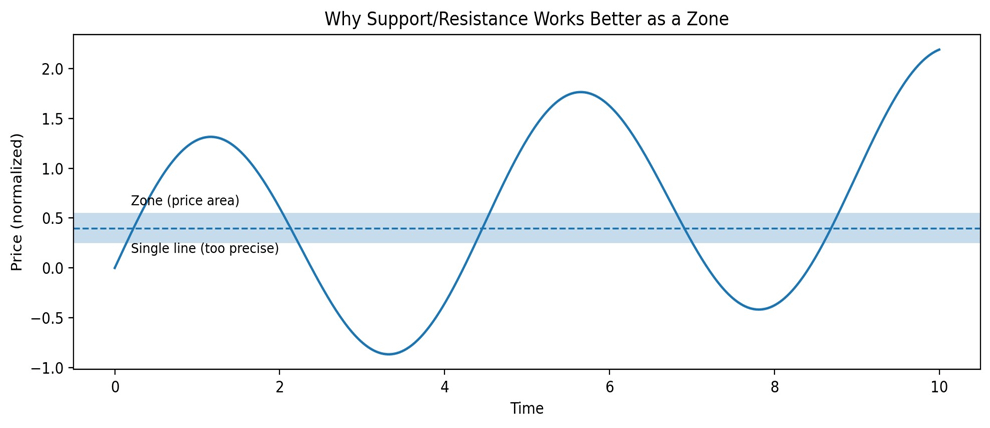
The key beginner mistake is treating support and resistance as exact prices. In real markets, levels behave more like zones. Different traders use different timeframes and exchanges, orders are spread out, and volatility pushes price slightly above or below a level. If you draw a razor-thin line and expect perfect touches, you will feel “tricked” by the market. If you draw a zone, you will see the market’s logic more clearly.
How to draw levels in minutes
You can learn to draw reliable levels in minutes by following a simple process: (1) zoom out, (2) mark obvious swing highs and lows, (3) refine to the levels that caused a clear reaction, and (4) keep only the levels that matter right now. A good level is not the one with the most touches. A good level is the one that clearly changed behavior: it stopped price, reversed it, or launched it into a strong move.
Step 1: start with the higher timeframe. If you trade on the 15-minute chart, begin on the 4-hour or daily chart first. Higher timeframe zones matter more because more participants can see them. Once you mark those bigger areas, then drop to your trading timeframe to fine tune entries. If you skip this step, you will often buy directly into a larger resistance (or sell into a larger support) without realizing it.
Step 2: mark swing highs and swing lows. A swing high is a peak with at least a few candles on each side that failed to break higher. A swing low is a trough with a similar structure that failed to break lower. These swings are visual evidence of supply and demand. When you see multiple swing highs near the same area, you are identifying where sellers repeatedly defended. Do the same for swing lows to find where buyers defended.
Step 3: prioritize zones with clean reactions. Look for places where price touched an area and then moved away with speed or larger candles. Those are the zones where the auction decisively shifted. In contrast, areas where price chopped sideways for a long time are less informative; they can matter, but they are harder to trade because they produce noise and false breaks.
Step 4: draw zones, not surgical lines. A quick method is to bracket the candle bodies that formed the turning point. If you want it even simpler, capture the cluster of closes, not the extreme wick. Wicks show rejection, but closes show agreement. For beginners, zones based on closes reduce frustration and improve consistency.
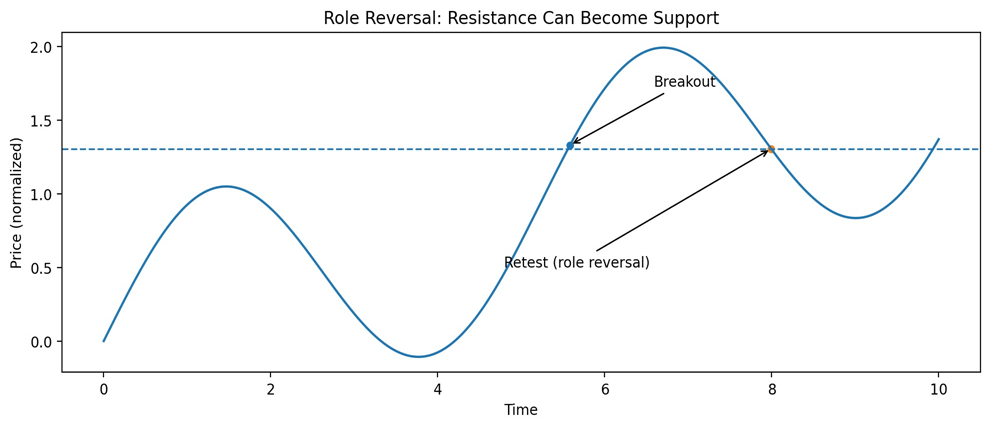
Role reversal: the move many beginners miss
Step 5: expect role reversal. One of the most useful patterns in market structure is that resistance can become support after a breakout, and support can become resistance after a breakdown. It happens because traders who sold at resistance may buy back if price re-tests the same area from above, while traders who missed the breakout use the pullback to enter. The retest is not guaranteed, but it is common enough that it should be part of your plan.
Using levels without getting chopped up
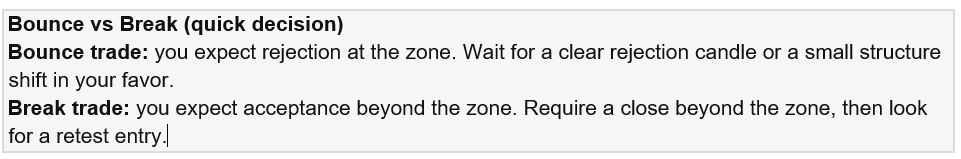
How to use support and resistance in a trade (the beginner-safe way): first decide whether you want to trade a bounce or a break. A bounce trade expects price to reject the zone. A break trade expects price to close beyond the zone and continue. For bounces, confirmation matters: look for rejection wicks, a strong counter candle, or a shift to higher highs/higher lows (at support) or lower highs/lower lows (at resistance). For breaks, require a close beyond the zone, not just a wick. Many beginners buy the first wick above resistance and then get trapped when price snaps back. Waiting for a close and a retest can reduce false signals.
Volume can add clarity, but it is optional. If you use it, keep it basic: strong volume into resistance with little upward progress often signals exhaustion, and a breakout with rising participation is generally healthier than a breakout on weak activity. But do not make volume a strict requirement. Your first job is to draw good zones and read the reaction.
A professional way to place stops and targets: place stops beyond the zone, not inside it. If support is a band, your stop should sit below the band (for a long) where your idea is clearly wrong. Targets should usually be the next obvious opposing zone. That gives you a natural map for risk and reward. If the next target is too close, skip the trade. Good support/resistance trading is not about being right often; it is about avoiding low-quality setups.
Risk management and common mistakes
Common mistakes to avoid:
(1) drawing too many levels, which creates analysis paralysis;
(2) using a single line instead of a zone;
(3) ignoring the higher timeframe;
(4) trading every touch with no confirmation; and
(5) moving levels constantly to “fit” the last candle. Your chart should be stable. If you keep redrawing, your zones are probably not clear enough.
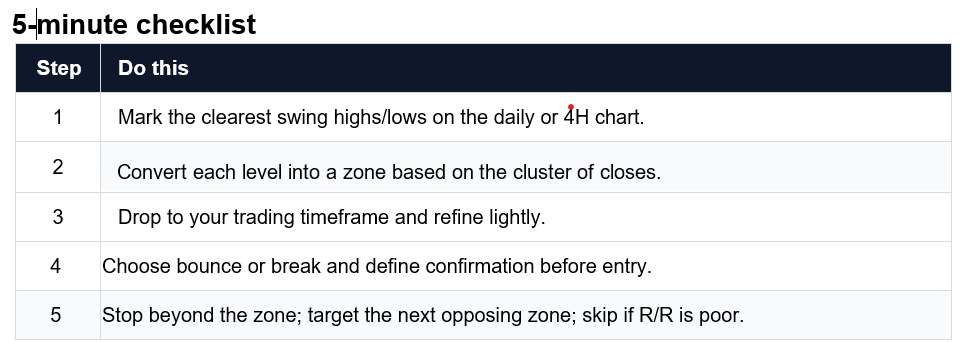
A 5-minute workflow you can reuse:
1) Zoom out to the daily or 4-hour and mark the clearest swing highs and lows. 2) Convert each level into a zone that covers the cluster of closes around the turning point.
3) Drop to your trading timeframe and refine lightly without contradicting the higher timeframe.
4) Decide: bounce or break. Define your confirmation before entry.
5) Place stop beyond the zone and target the next zone.
If the risk/reward is poor, do nothing. With practice, support and resistance becomes less about drawing lines and more about reading the auction: where did the market last prove that buyers or sellers were in control, and what would prove that control has changed?
A 5-minute workflow you can reuse:
1) Zoom out to the daily or 4-hour and mark the clearest swing highs and lows.
2) Convert each level into a zone that covers the cluster of closes around the turning point.
3) Drop to your trading timeframe and refine lightly without contradicting the higher timeframe.
4) Decide: bounce or break. Define your confirmation before entry.
5) Place stop beyond the zone and target the next zone. If the risk/reward is poor, do nothing.
With practice, support and resistance becomes less about drawing lines and more about reading the auction: where did the market last prove that buyers or sellers were in control, and what would prove that control has changed?