Here’s a precise breakdown of your Bitcoin technical update and what it implies:
Current Price Action
Bitcoin range: $68,090 – $69,162 (1-hour observation)
Market cap: $1.36T
24h volume: $97.38B
Intraday range: $66,131 – $71,604
Observation: Market has stopped panicking but lacks conviction—traders are indecisive.
Key takeaway: Price is compressing between support ($66,000–$68,000) and resistance ($70,500–$71,700), often a precursor to a volatility expansion (sharp move in either direction).
Technical Structure
Daily Chart
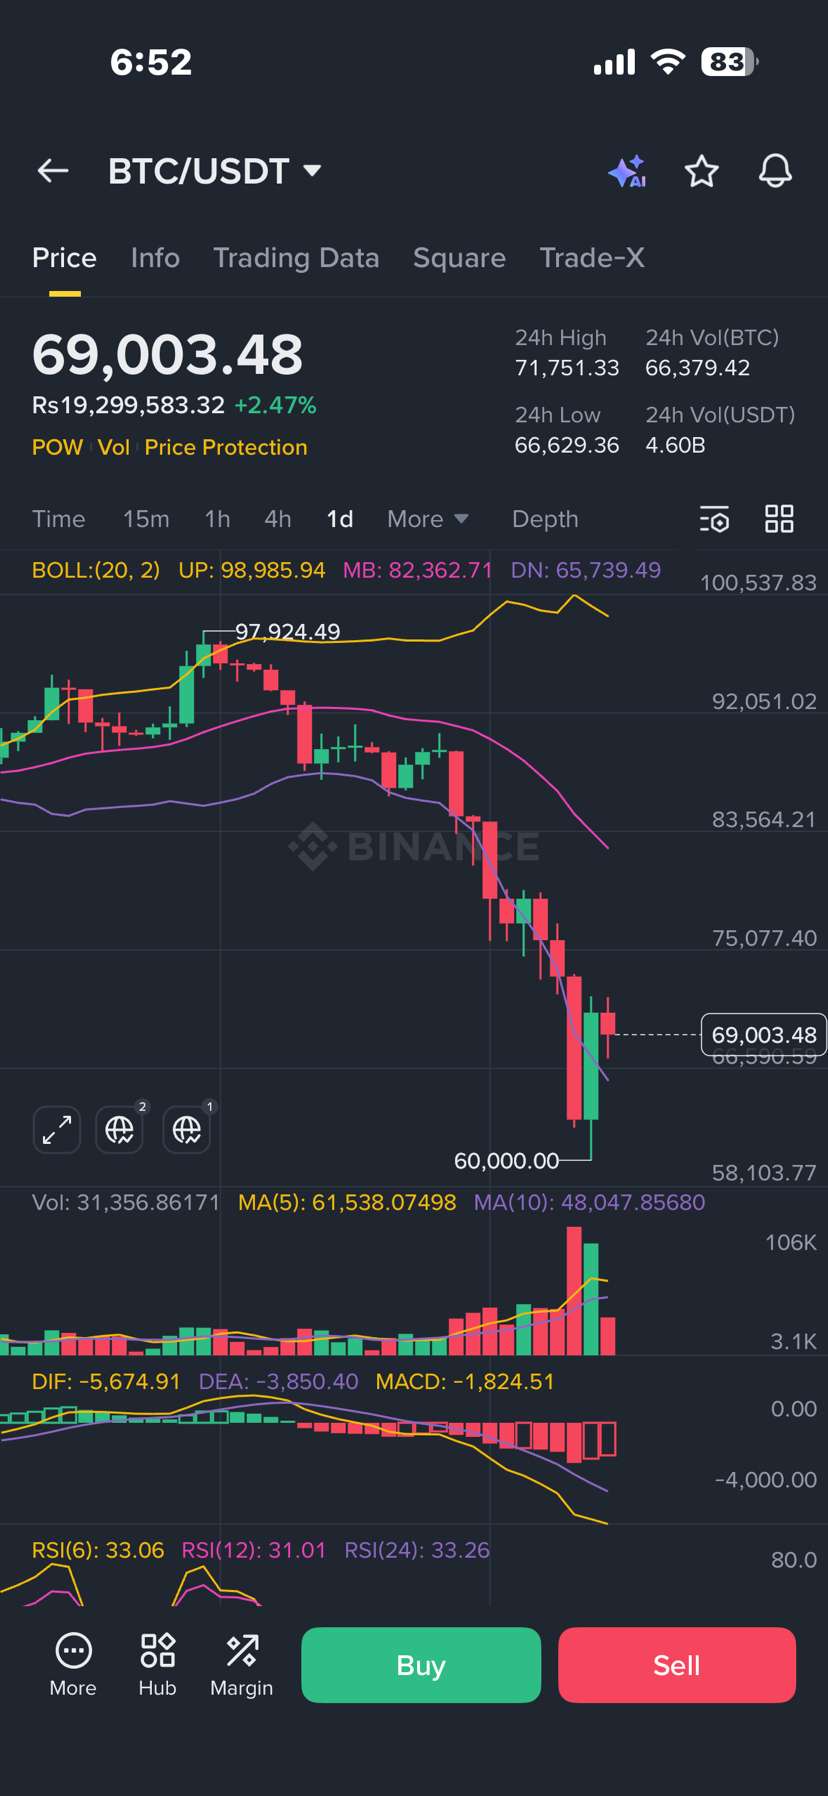
Clear downtrend from $97,900 high to capitulation low at $59,930.
Recent rebound appears reflexive, not trend reversal.
Volume: surged during the sell-off, faded on recovery—classic panic → stabilization pattern.
Trend verdict: Broader market still corrective; only reclaim above $75K would signal a real shift.
1-Hour Chart
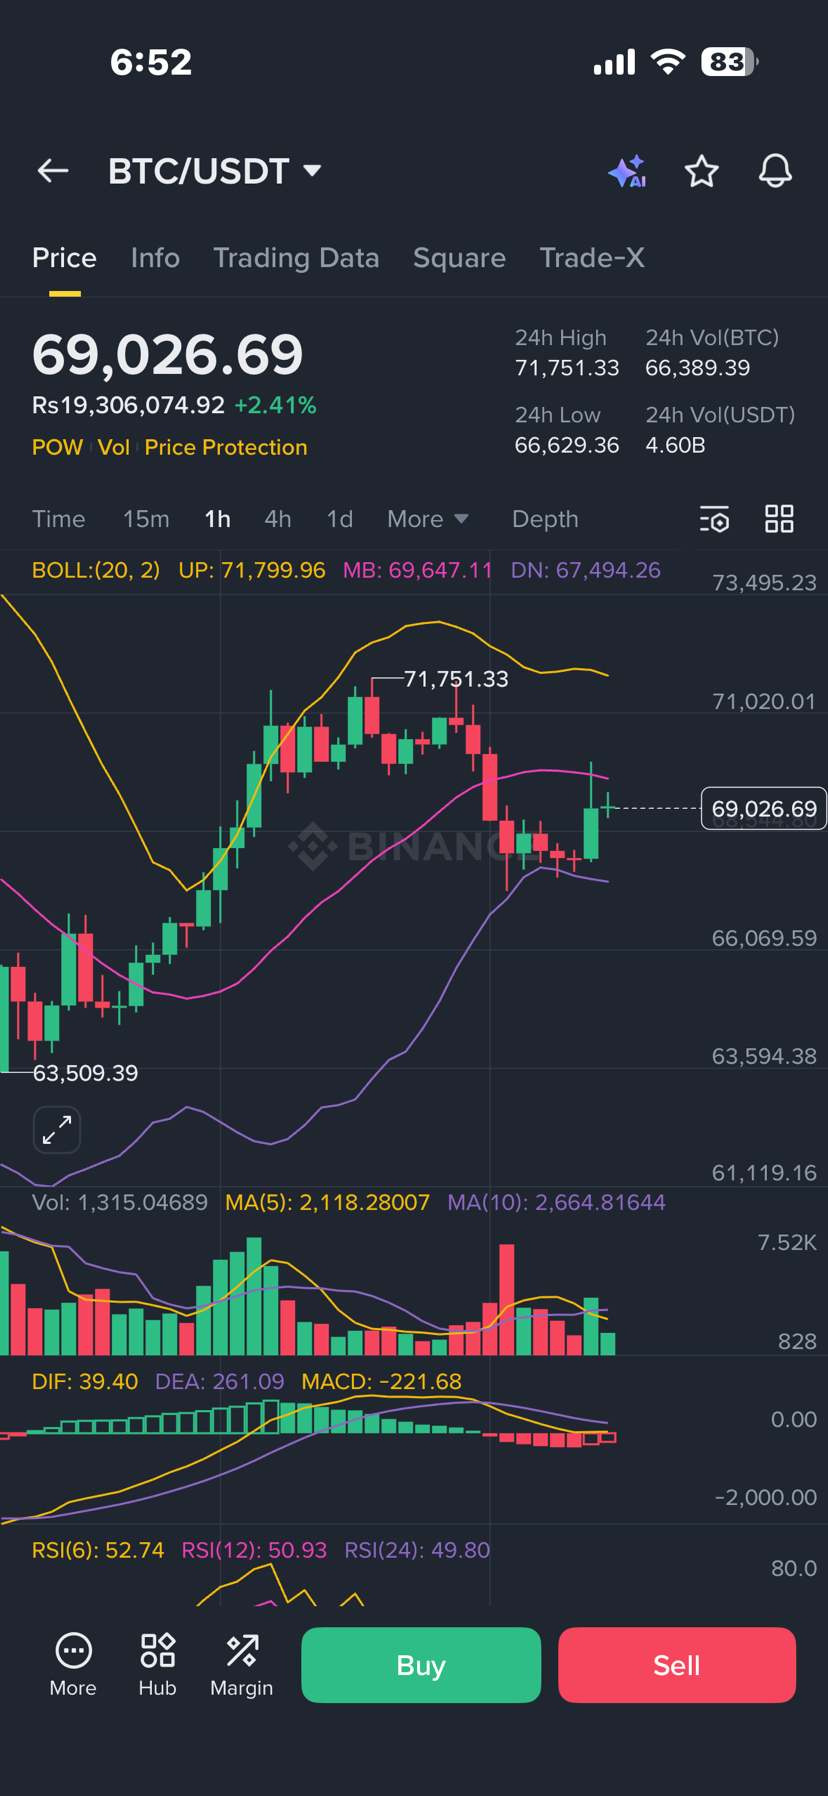
Short-term uptrend from $59,930 stalled at $71,673 → forming lower highs.
Current price oscillation around $68–69K = intraday balance, low conviction.
Support/Resistance
Support: $67,500 – $68,000
Resistance: $70,500 – $71,700
Indicators
RSI: 31 → near oversold
Stochastic: 21 → near oversold
CCI: −122 → deeply negative
ADX: 44 → confirms strong trend (currently downtrend)
MACD & momentum: firmly negative
Moving Averages: 10 EMA → 200 SMA all above current price, creating a strong overhead ceiling
Interpretation: Momentum is negative, but compressed price and low volume suggest potential for breakout if a catalyst emerges.
Scenarios
Bull Case
Price holds above $66–68K support
Short-term compression resolves with breakout above $71–72K
Could confirm the $59,930 low as a meaningful exhaustion point
Signals short-term relief rally or trend shift
Bear Case
Daily downtrend intact, negative momentum dominates
Price remains below all major moving averages
Rebounds stall at prior breakdown zones
Failure to reclaim $75K → corrective rallies, risk of renewed downside if $66K breaks
Summary
Bitcoin is compressed and indecisive between support and resistance.
Technicals favor bearish structure overall but show short-term potential for volatility expansion.
Key levels to watch:
Support: $66K–$68K
Resistance: $71K–$72K
Trend shift threshold: $75K
Bottom line: The market is at a technical inflection point. Compression signals a decisive move is coming, but current indicators strongly favor caution until $75K is reclaimed or $66K breaks.