🕯 BTC Short Candle Analysis
Current Structure:
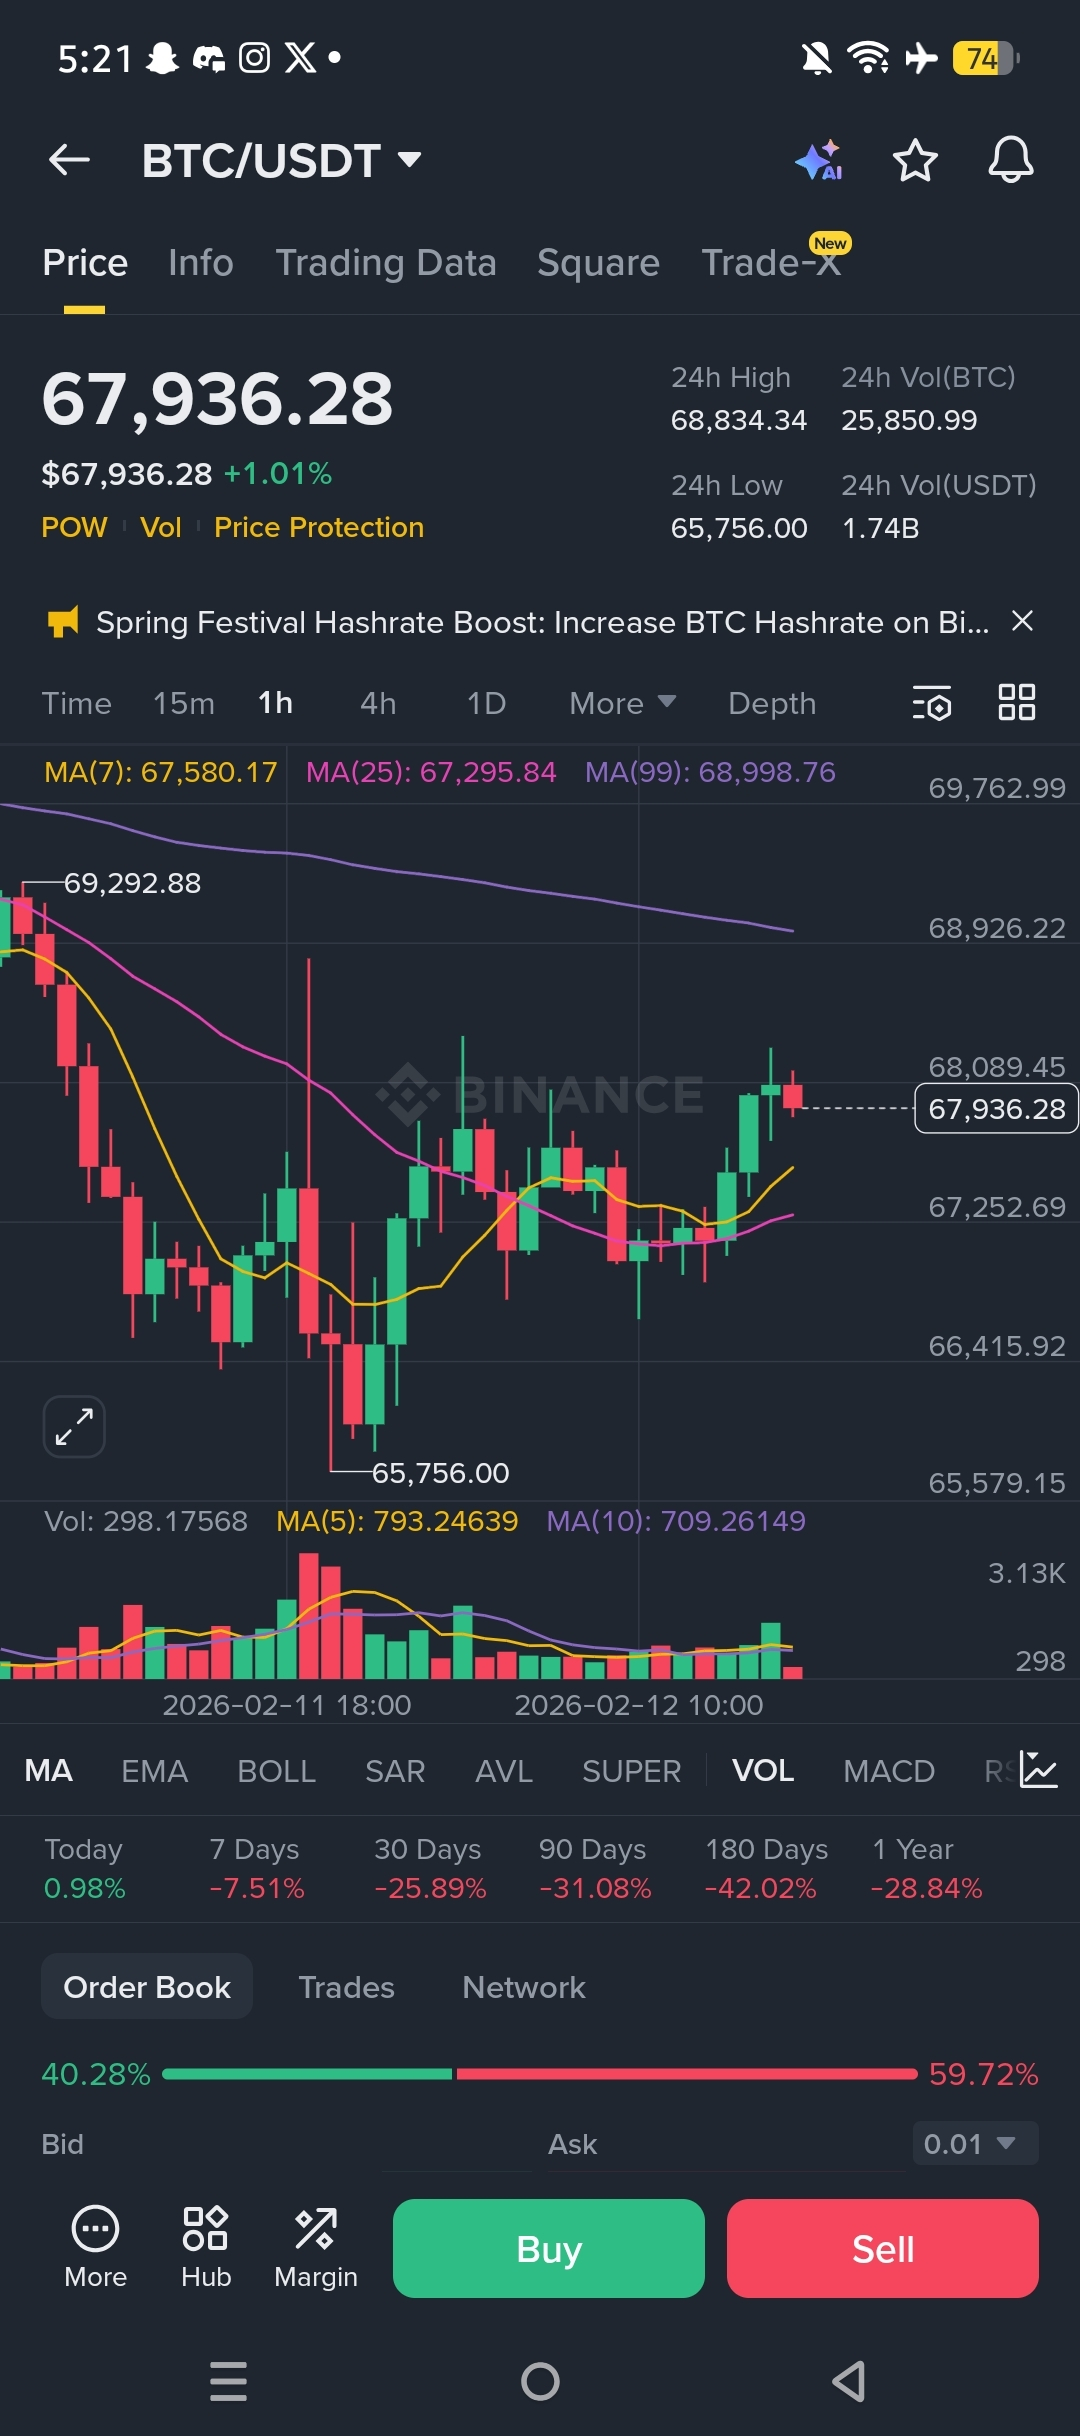
BTC is trading inside a short-term range after a recent impulse move. The last few daily candles show smaller bodies with longer wicks, signaling indecision between buyers and sellers.
Recent Candles:
A strong bullish engulfing candle pushed price into resistance.
Followed by 2–3 rejection wicks near the top — showing supply pressure.
Volume has slightly cooled compared to the breakout candle.
Key Levels:
🟢 Support: Previous breakout zone / last bullish engulfing low
🔴 Resistance: Recent wick highs (local top area)
What the Candles Are Saying:
If we get a strong full-body bullish close above resistance, continuation toward the next liquidity zone is likely.
If a bearish engulfing forms near resistance, expect a pullback toward support before the next move.
A tight consolidation with decreasing volatility usually precedes expansion — so a volatility spike is likely soon.
Bias (Short-Term): Neutral-to-bullish while holding above support
Break below the last higher low = momentum shifts bearish