$BITCOIN has dropped 53% in the last 4 months — and many didn’t expect this level of volatility. Some thought ETFs would reduce volatility… but the reality?
👉 Crypto is still extremely volatile.
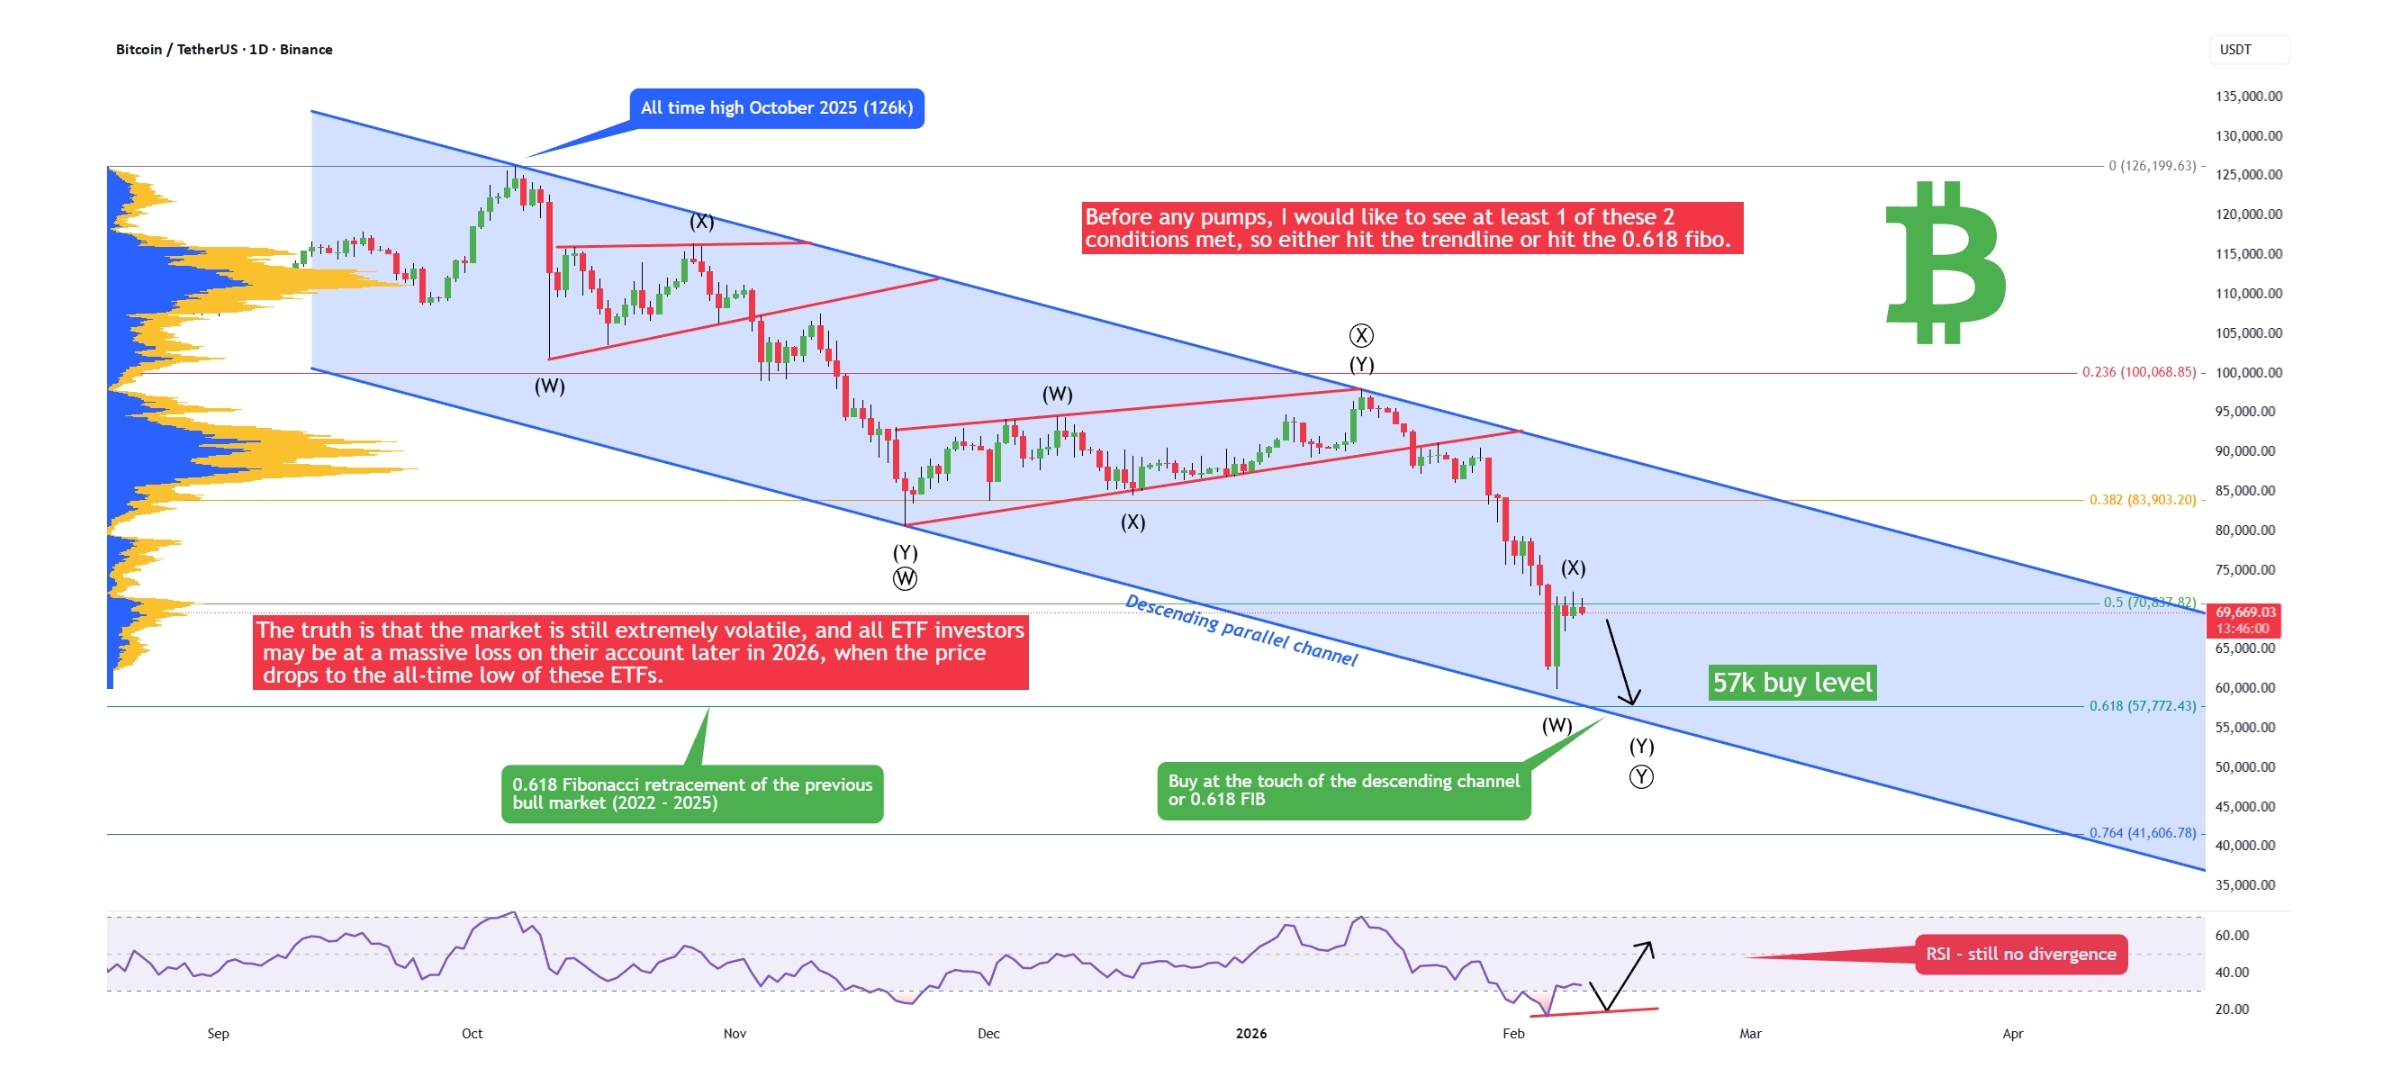
Now let’s break this down technically and professionally 👇
📉 1️⃣ 0.618 Fibonacci Retracement Still Untouched
$BTC has NOT yet tapped the 0.618 Fibonacci retracement of the 2022–2025 bull cycle.
📍 That level sits around $57,772 USDT.
And in technical analysis, the 0.618 level acts like a strong liquidity magnet.
Until that level is tested, downside pressure remains valid.
📊 2️⃣ Parallel Channel Trendline Not Hit
On the daily chart, $BITCOIN is trading inside a descending parallel channel.
Price hasn’t touched the lower trendline yet.
Markets love symmetry — and incomplete structures often get completed.
That makes the lower boundary another potential downside target.
🌊 Elliott Wave Perspective
Current structure looks like a complex corrective pattern (W)(X)(Y).
We may still be missing the final (Y) wave — meaning one more push down before any sustainable reversal.
Also:
RSI is oversold ❗
But there’s NO bullish divergence yet — which is usually needed for a strong reversal signal.
🎯 Short-Term Outlook
I remain bearish in the short term.
A move toward the 57K zone looks highly probable before any real bullish continuation.
Remember:
Big institutions need liquidity.
Liquidity = stop losses.
And markets often sweep retail stops before the next major move.
⚠️ Stay patient.
⚠️ Let the structure complete.

#bitcoin #BTCMiningDifficultyDrop #BitcoinGoogleSearchesSurge #USIranStandoff