
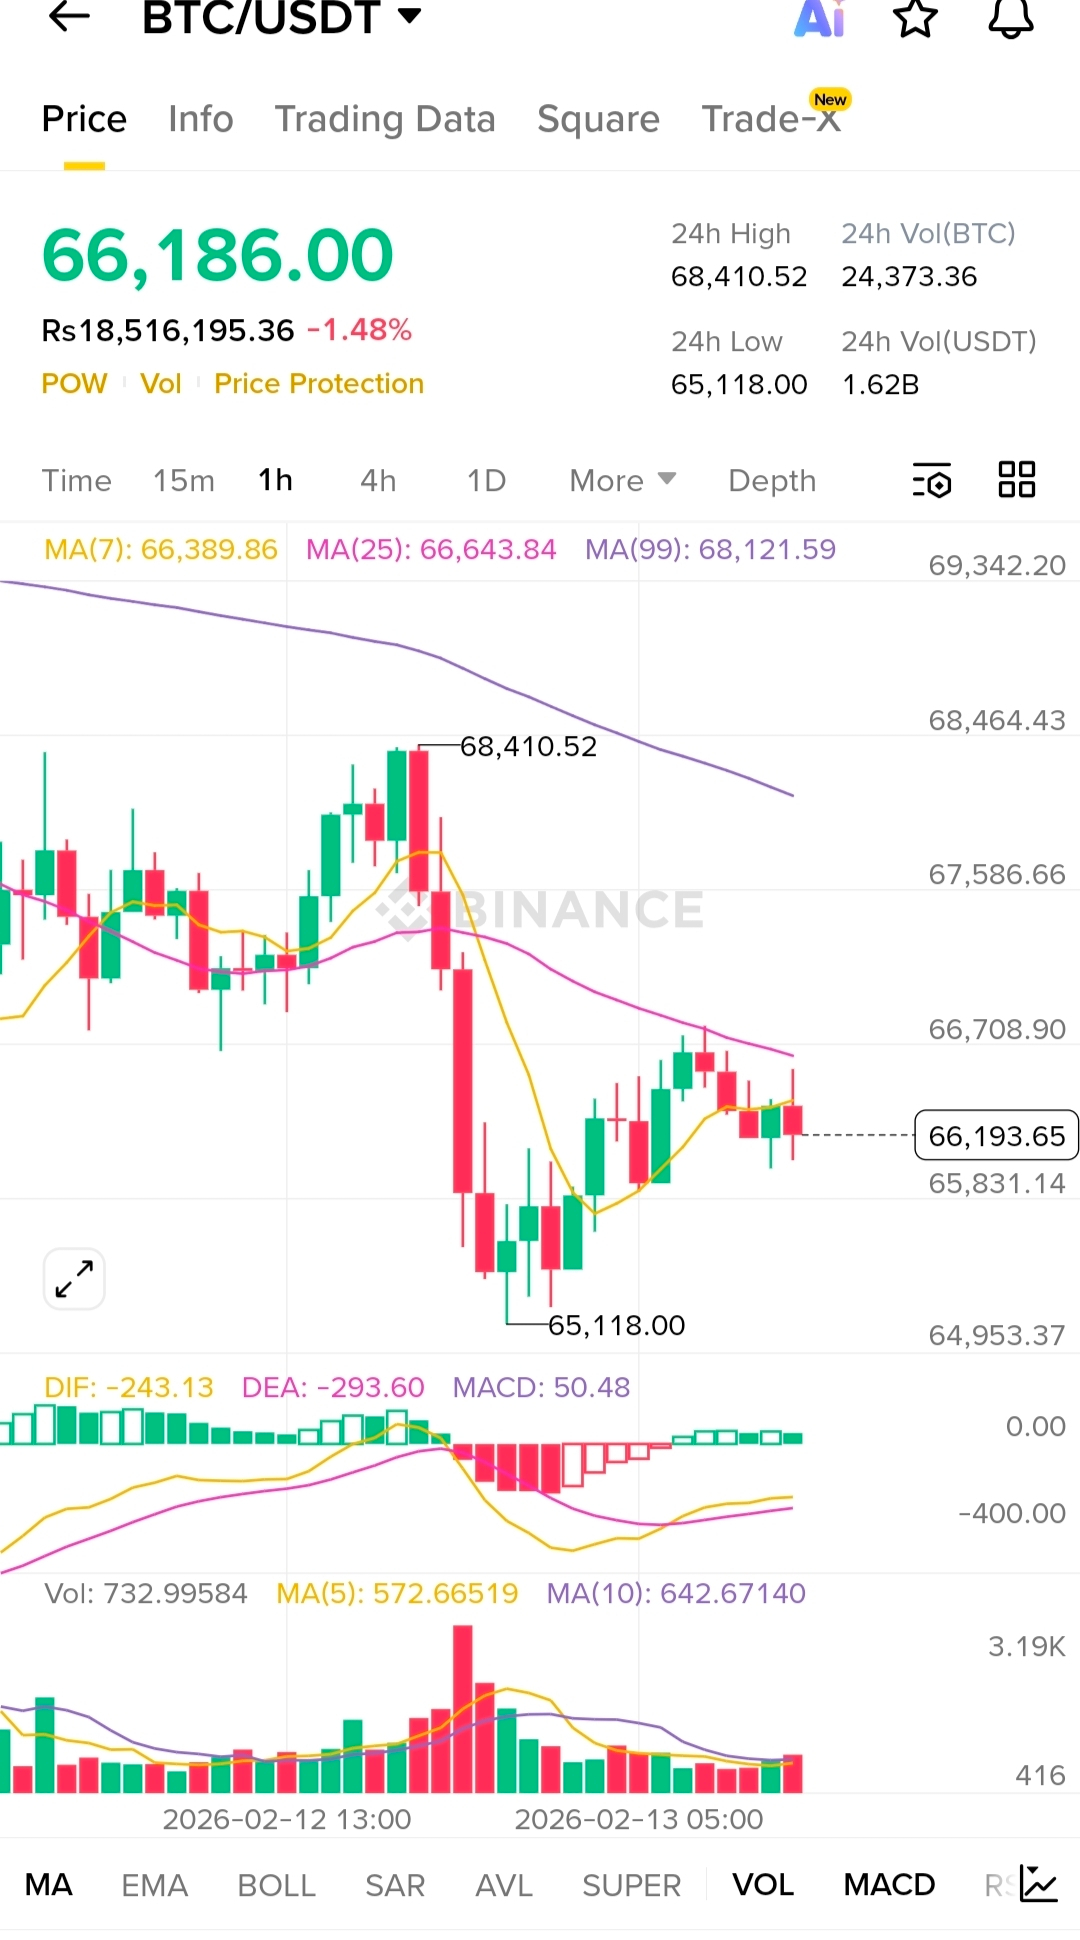
Bitcoin ( $BTC /USDT) is trading around $66,186, down roughly 1.48% on the session. Price printed a 24-hour high near $68,410.52 and then dropped aggressively to a session low around $65,118.00 before attempting a bounce.
This isn’t random movement. It’s structure shifting in real time.
Let’s break it down clearly price, moving averages, momentum, and then what you should actually do if the market weakens further.
First, price action.
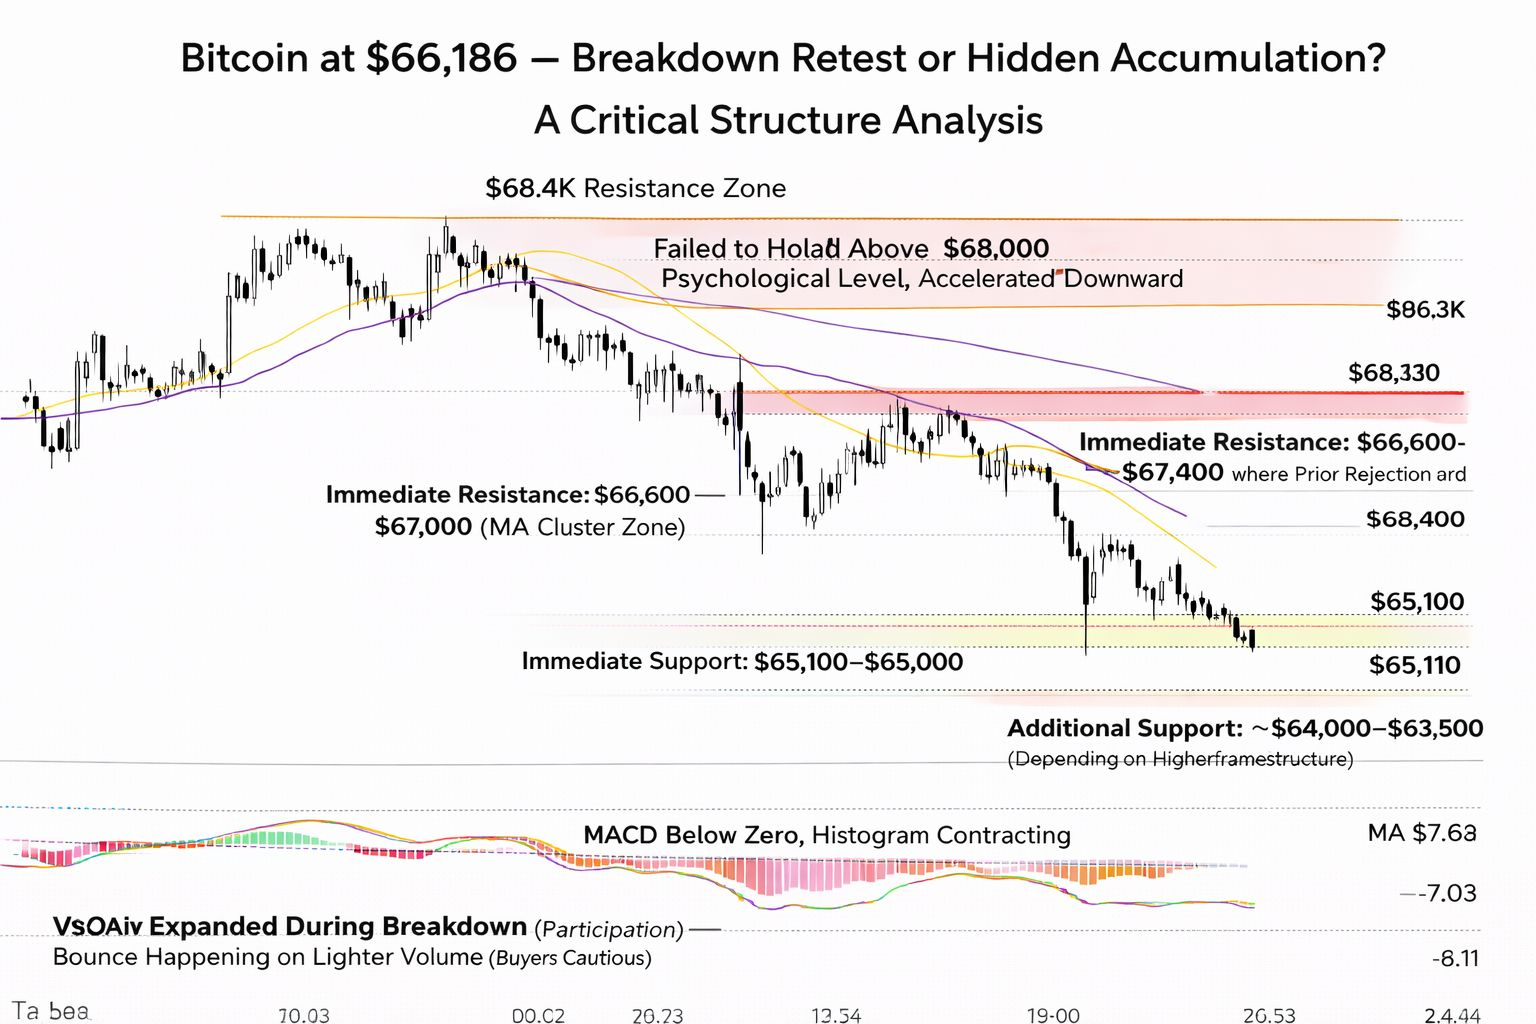
Bitcoin pushed toward the $68.4K resistance zone and failed to sustain momentum above it. The rejection was sharp. From there, we saw a sequence of strong red candles that sliced through short-term support and accelerated into the $65.1K liquidity pocket.
That type of impulsive move usually signals forced selling not slow distribution. When price drops that quickly, it often means leveraged longs were liquidated. It’s a reset event.
After touching $65,118, $BTC bounced back toward the $66.2K–$66.7K region, but the recovery has been relatively controlled, not explosive. That matters.
Now look at the moving averages.
MA(7) is around $66,389, MA(25) near $66,643, and MA(99) around $68,121.
Price is currently trading below all three moving averages. The short-term MA(7) has rolled over and crossed below the MA(25), and both are sloping downward. The MA(99) is positioned well above current price, acting as overhead resistance.
This is textbook short-term bearish structure.
When price trades below the 25 and 99 moving averages with separation expanding, it usually signals momentum control by sellers. Until Bitcoin reclaims the $66.6K–$67K region and holds above it with strength, any bounce remains fragile.
Now let’s talk about momentum.
MACD recently flipped negative during the selloff. DIF crossed below DEA, and although the histogram is beginning to contract slightly, we’re still in negative territory. That tells us selling pressure is slowing — but not necessarily reversing.
Contraction is not confirmation.
Many traders confuse slowing downside momentum with bullish reversal. They are not the same thing.
Volume confirms the story.
The drop from $68.4K to $65.1K came with expanded volume. That shows participation. The bounce toward $66.2K has occurred with lighter relative volume. That suggests buyers are cautious.
This is the first major educational lesson:
Not every bounce is a reversal. Some are relief moves inside broader corrective phases.
Now let’s define levels clearly.
Immediate support: $65,100–$65,000.
If this level breaks decisively, the next liquidity pocket may sit near $64K–$63.5K, depending on higher-timeframe structure.
Immediate resistance: $66,600–$67,000 (MA cluster zone).
Stronger resistance: $68,000–$68,400, where prior rejection occurred.
For bulls to regain control, BTC needs to reclaim $67K with expanding volume and build higher lows above $66.5K.
For bears to extend dominance, a breakdown below $65.1K with renewed momentum would likely trigger another wave of liquidations.
Now let’s shift from analysis to education.
What should you do in this environment?
First: reduce leverage.
Volatility expands when structure breaks. If you’re trading with leverage and cannot survive a 5–10% move against you, your position is too large. Most retail accounts are not wiped out by bad analysis — they’re wiped out by oversized positions.
Second: define invalidation before entry.
If you long near $66K, ask yourself clearly:
If $65.1K breaks, do you exit — or do you hope?
Hope is not risk management.
Third: respect timeframe alignment.
The 1-hour chart may show stabilization, but the 4-hour or daily could still be in a corrective phase. Never trade a lower timeframe without understanding the higher one.
Fourth: avoid emotional averaging down.
Buying aggressively just because price dropped from $68.4K to $66K is not strategy. A proper entry requires confirmation: reclaimed resistance, higher low formation, expanding bullish volume.
Fifth: protect mental capital.
Sharp drops create urgency. Urgency creates impulsive decisions. Impulsive decisions create permanent losses.
Sometimes the most profitable trade is no trade.
Another critical lesson is understanding liquidity events.
Moves like the drop from $68.4K to $65.1K often flush overleveraged positions. After that flush, markets sometimes consolidate before deciding the next direction.
But consolidation does not equal strength.
Ask yourself rational questions instead of reacting emotionally:
Is this a healthy pullback inside a larger uptrend?
Or is this the beginning of a lower-high sequence?
Is volume expanding on rallies or only on selloffs?
Price tells the truth before narratives catch up.
If the market deteriorates further:
Lower correlated exposure in your portfolio.
Increase cash or stable allocations temporarily.
Reduce risk per trade to 1–2% of total capital.
Avoid revenge trading after a loss.
Capital preservation during corrective phases is more important than chasing recovery trades.
In bull markets, everyone focuses on maximizing gains.In corrective markets, professionals focus on minimizing damage.
Survival is strategy.
Here’s my balanced take.
Bitcoin at $66,186 is attempting stabilization after an impulsive breakdown. The market is testing whether buyers are willing to defend the $65K zone. So far, the bounce is controlled not aggressive.Until $BTC reclaims $67K with conviction and holds above the MA cluster, the structure remains fragile short term.
The goal isn’t to predict the next candle.The goal is to position yourself so that:
If you’re wrong, the loss is small.If you’re right, the reward compounds.
Markets will always test discipline.
What determines long-term success isn’t whether Bitcoin bounces today.It’s whether you manage risk properly when it doesn’t.