

Technical Analysis (TA) is one of the most important skills for any trader who wants to understand market behavior. Instead of relying on news or predictions, technical analysis focuses on price action, chart patterns, indicators, and market psychology to forecast potential moves.
Whether you trade crypto, stocks, or forex, TA helps you:
Identify trends
Find entry and exit points
Manage risk
Avoid emotional trading
This guide will walk you step-by-step through everything from beginner basics to advanced concepts.
1. Understanding Candlesticks
Candlestick charts are the foundation of technical analysis. Each candle represents price movement over a time period.
Parts of a Candle:
Open → price at start
Close → price at end
High → highest price
Low → lowest price
Meaning
Green candle → buyers controlled market
Red candle → sellers controlled market
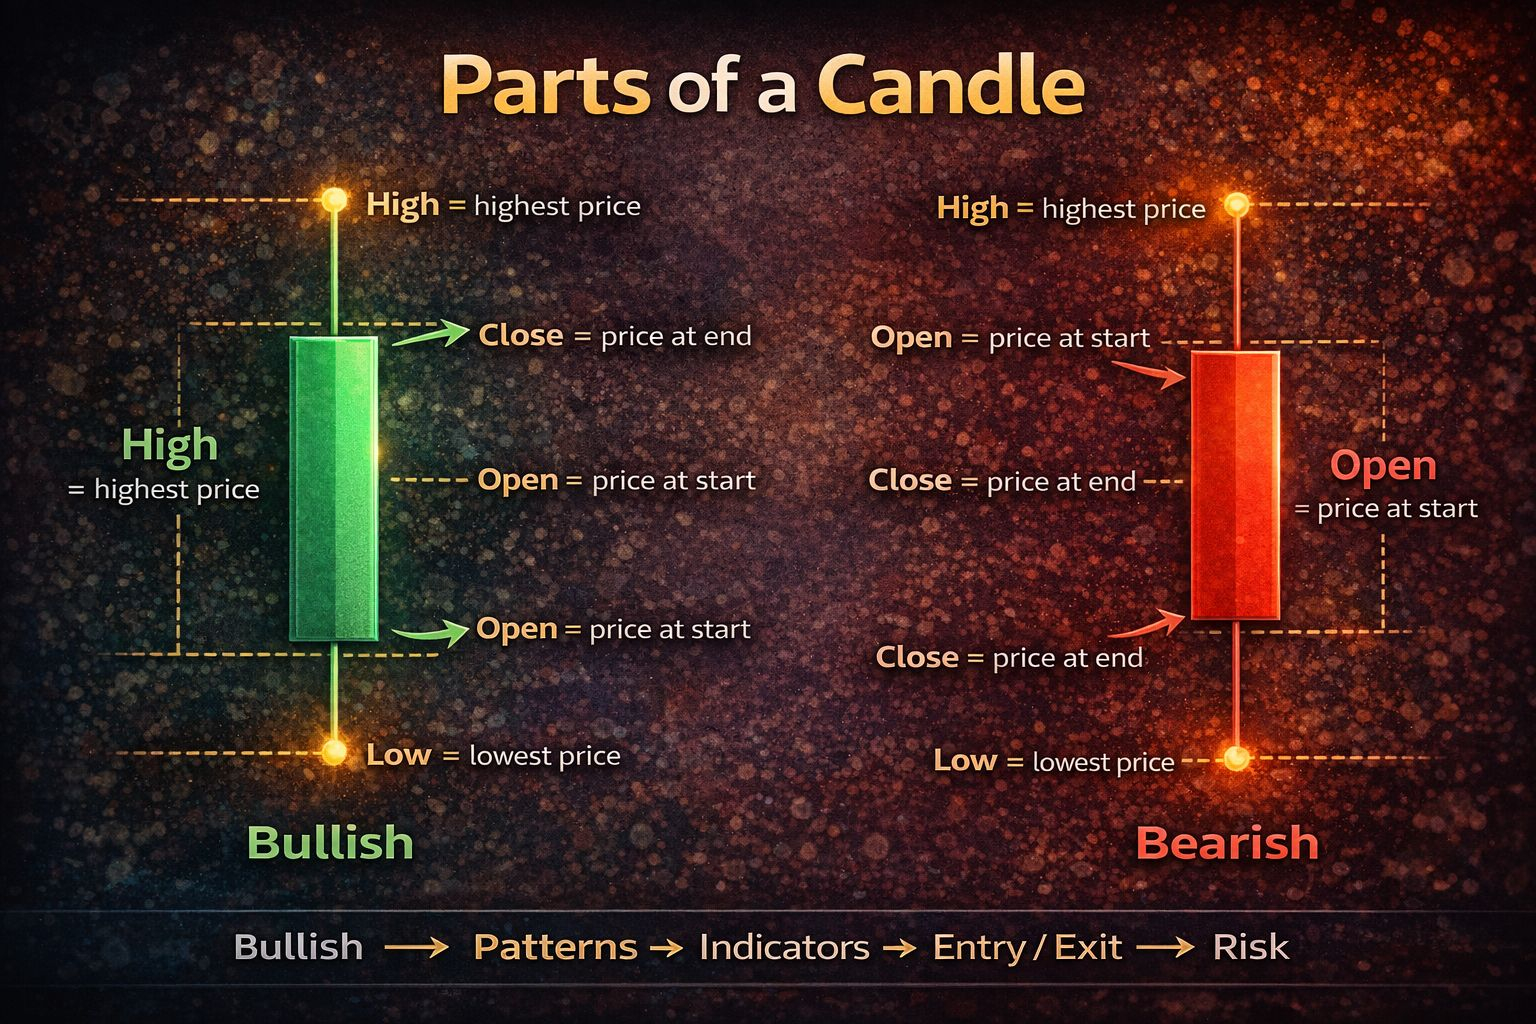
Candlestick patterns like Doji, Engulfing, Hammer help traders identify reversals or continuation.
2. Support and Resistance
Support and resistance are the most powerful concepts in trading.
Support = price level where buyers usually enter
Resistance = price level where sellers usually enter
Markets often:
Bounce from support
Reject from resistance
Break out and trend
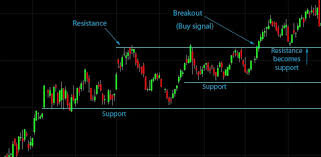
Pro traders watch these zones closely because they show where big money is active.
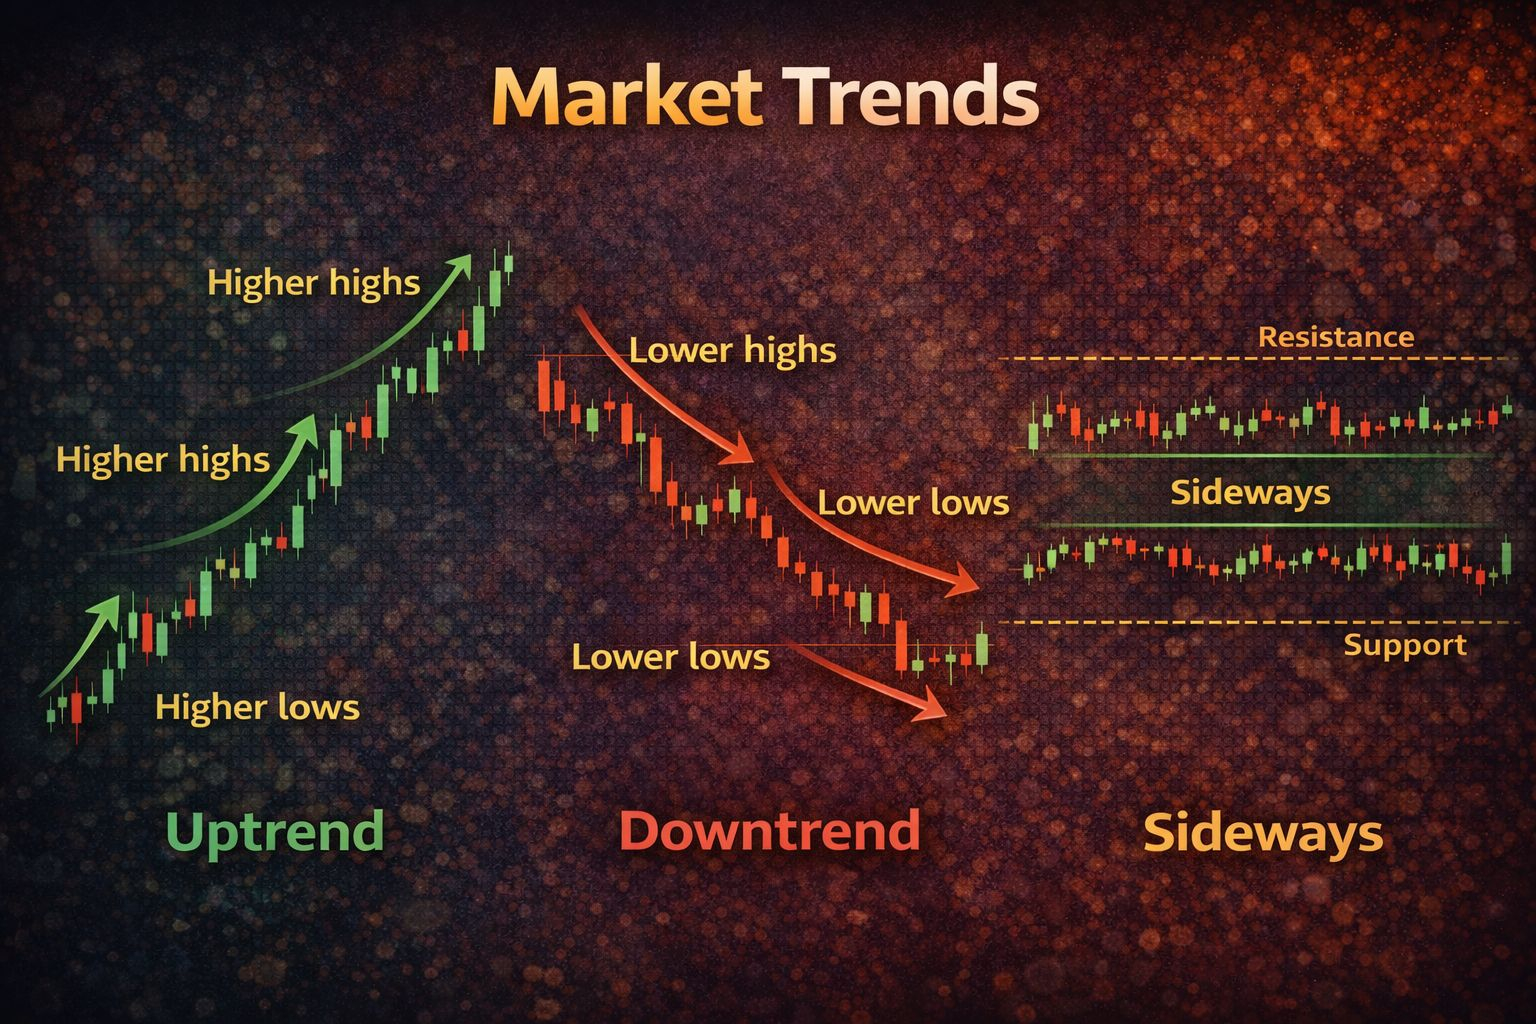
3. Trend Identification
Trend is your best friend in trading.
There are only three market directions:
Uptrend → higher highs + higher lows
Downtrend → lower highs + lower lows
Sideways → consolidation
Golden rule:
Trade with the trend, not against it.
Beginners lose money mostly because they try to predict reversals instead of following trend direction.
4. Chart Patterns
Chart patterns repeat because human psychology repeats.
Common patterns:
Bullish Patterns
Ascending Triangle
Bull Flag
Cup and Handle
Bearish Patterns
Head and Shoulders
Descending Triangle
Double Top
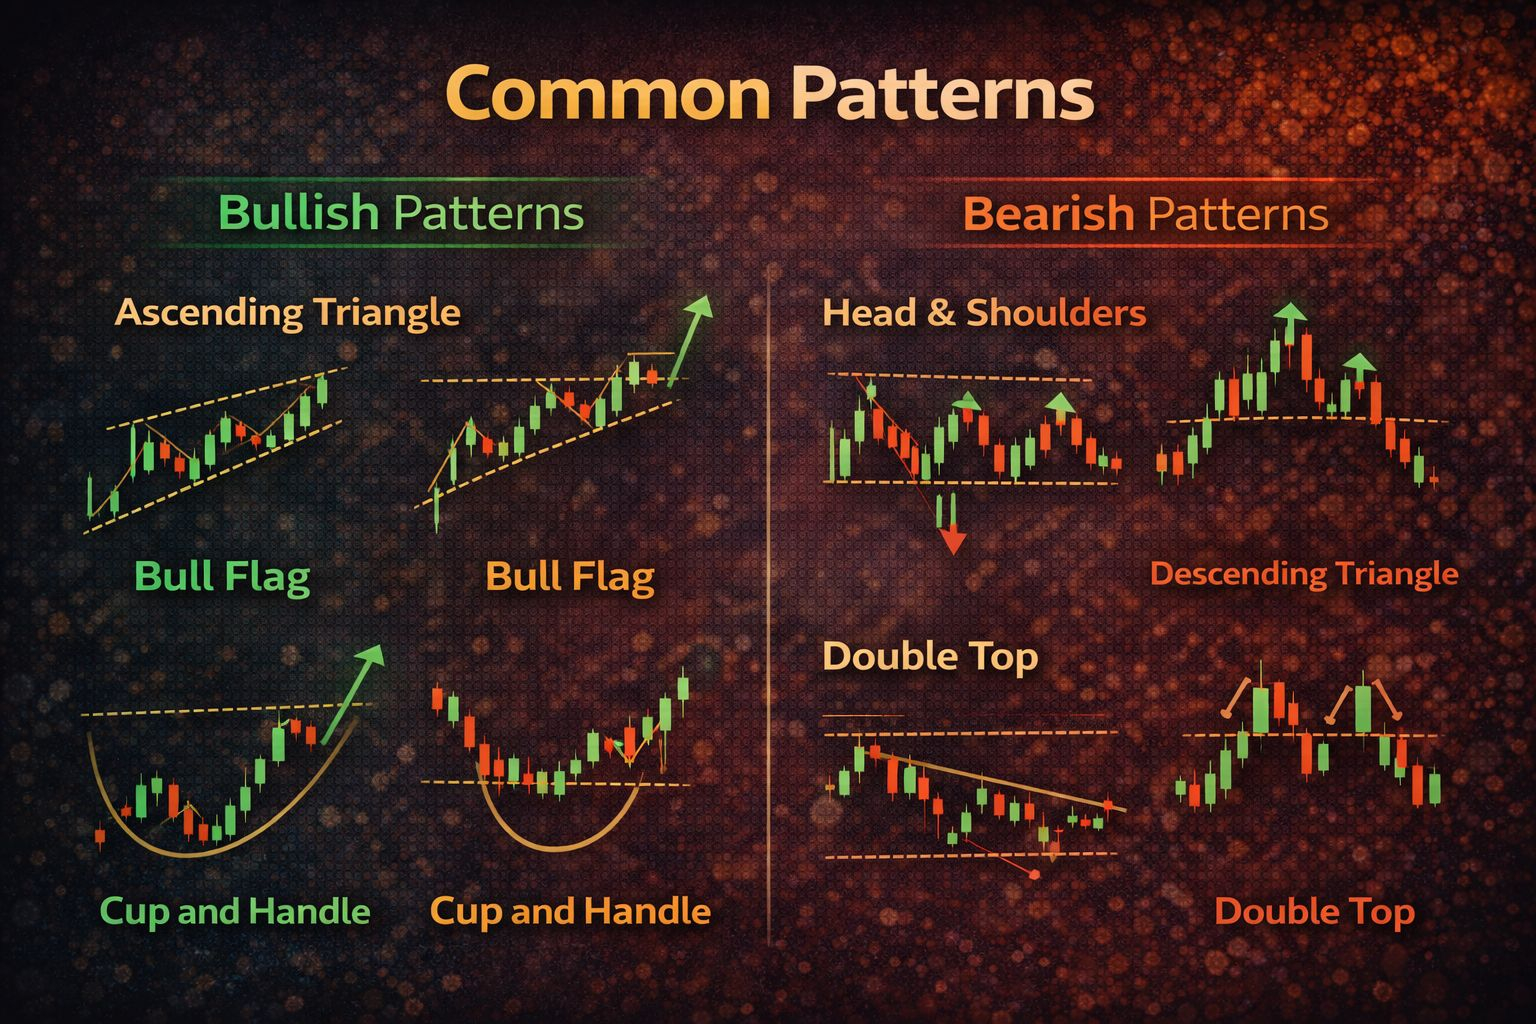
Patterns don’t guarantee price moves — they only increase probability.
5. Indicators Every Trader Should Know
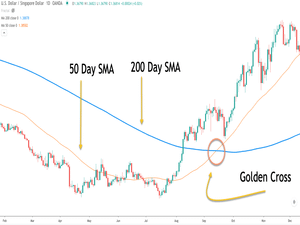
Moving Averages (MA)
Shows trend direction and dynamic support/resistance.
Popular settings:
50 MA → short trend
200 MA → long trend
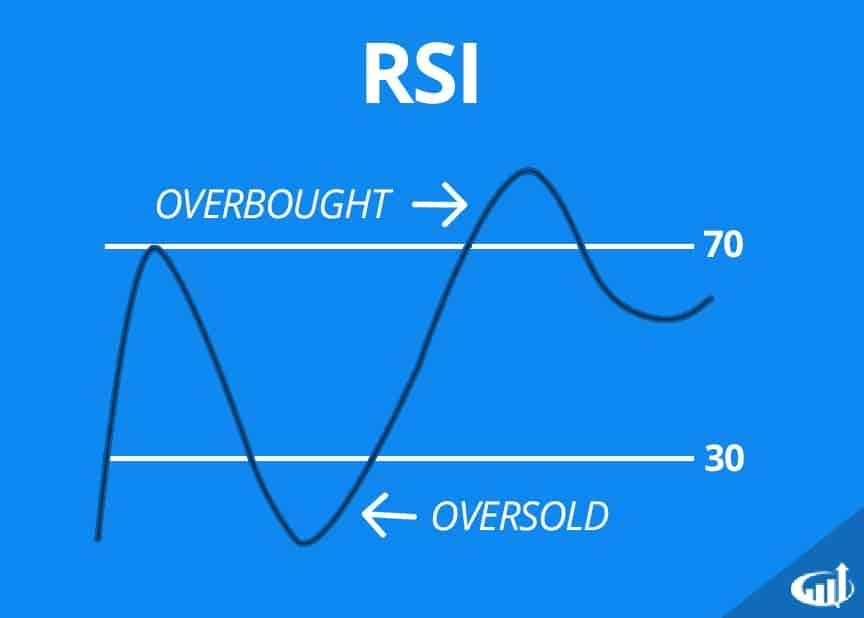
RSI (Relative Strength Index)
Measures momentum.
Above 70 → overbought
Below 30 → oversold
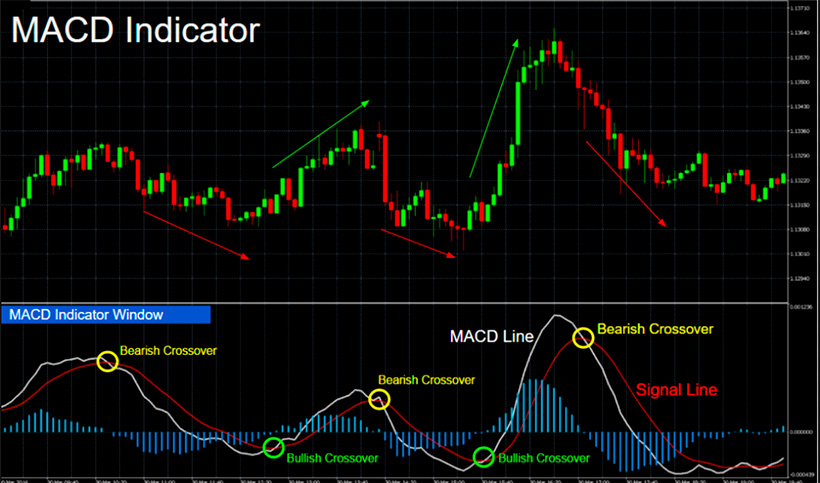
MACD Moving Average Convergence Divergence
Shows trend strength and crossovers.
Signals:
Bullish crossover → possible upward momentum
Bearish crossover → possible downward momentum
6. Entry and Exit Strategy
Good analysis is useless without a plan.
Before entering a trade always define:
Entry price
Stop loss
Take profit
Professional traders focus more on risk control than profits.
7. Risk Management (Most Important Section)
This is what separates professionals from gamblers.
Rules:
Risk only 1–2% per trade
Always use stop loss
Never revenge trade
Don’t overleverage
Risk management is the reason some traders stay profitable even with only 50% win rate.
8. Multi-Timeframe Analysis
Smart traders analyze multiple timeframes.
Example method:
Daily chart → overall trend
4H chart → structure
1H chart → entry
This prevents bad trades against higher-timeframe trends.
9. Psychology of the Market
Charts reflect human emotions:
Fear
Greed
Panic
Euphoria
When everyone is bullish → market often near top
When everyone is bearish → market often near bottom
Understanding sentiment gives traders a major edge.
Final Thoughts
Technical analysis is not magic. It doesn’t predict the future with certainty. Instead, it gives traders a probability advantage.
Successful traders don’t try to be right every time. They focus on:
Discipline
Risk control
Consistency
Master those three, and technical analysis becomes a powerful weapon in your trading journey.
✅ Pro Tip:
Best traders combine:
Candlesticks + Trend + Support/Resistance + Indicators + Risk Management
That combination is where real consistency comes from.