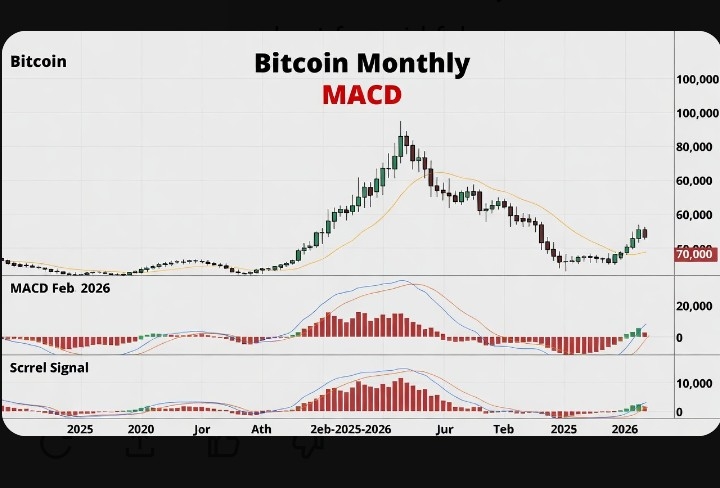
Here is a current analysis and representation of the Bitcoin (BTC/USD) monthly MACD chart as of mid-February 2026.Bitcoin is trading around $69,000–$70,500 (with recent closes in the $68k–$70k range on various exchanges like Bitstamp/Coinbase).Monthly MACD Status (12, 26, 9 settings – standard)
The monthly MACD line remains positive but has been steadily declining since the 2025 peak.
A bearish crossover occurred around late 2025 (MACD line crossed below the signal line), with the histogram turning and staying negative since then.
Current histogram is deeply negative (widening bars downward), confirming accelerating bearish momentum on this long timeframe.
This setup echoes historical major corrections (e.g., post-2017, post-2021 tops) where the monthly MACD bearish phase lasted many months and produced 40–80% drawdowns from cycle highs.
The MACD has not yet crossed back below the zero line (still above zero overall), but it's trending toward that level — a zero-line cross would mark an even stronger multi-year bear signal.
Key Price Context on Monthly Chart
All-time high: ~$115k–$126k (mid/late 2025)
Current price: ~$70k area → roughly -40% to -45% drawdown from peak
Structure: Series of lower highs and lower lows since Q4 2025
Major supports in play: ~$65k (recent swing low zone), ~$60k psychological + previous resistance flip, then deeper toward $50k–$55k if momentum continues unchecked
Visual Description of the Current Monthly MACD ChartImagine (or view on TradingView by setting timeframe to "1M" on BTCUSD):
Candles: Large red bodies dominating late 2025 into 2026, with wicks testing lower but failing to hold recoveries.
MACD panel (bottom): Blue MACD line curving downward, now below orange signal line.
Histogram: Tall red (negative) bars growing taller each month → bearish momentum increasing, not fading.
No bullish divergence visible yet on monthly; price and MACD both making lower lows.
This remains a defensive / bearish bias on the monthly timeframe. A reversal would require:
Price holding a major support and forming higher lows.
 Histogram flipping positive and expanding.
This is not financial advice — the monthly MACD is a slow, high-conviction indicator, but crypto remains extremely volatile. Always combine with risk management and multiple timeframes. Let me know if you'd like a zoom-in on weekly/daily MACD or other indicators! #BTCMonthlyMACD #MACDCrossOver #BTC突破7万大关 #MACD #btcrebound
