

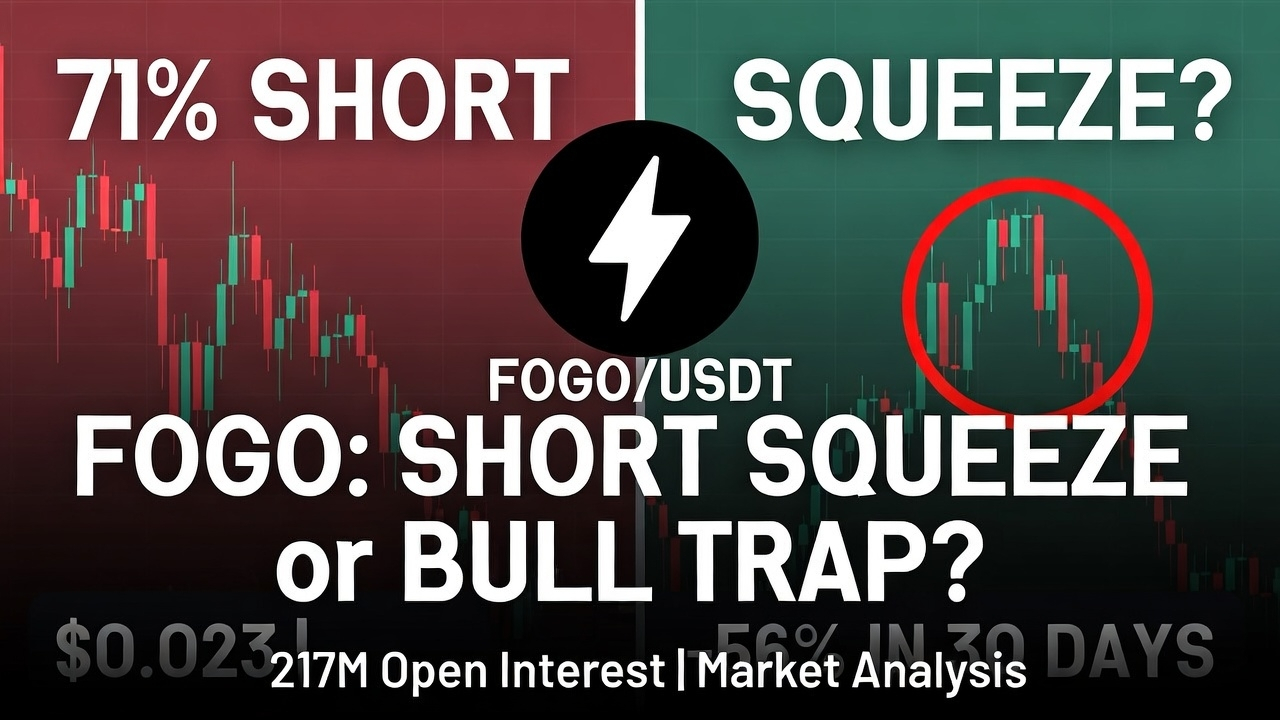
FOGO/USDT, and the sharks are circling. After a catastrophic 56% monthly collapse, this infrastructure token is showing signs of life at $0.02334 (up 1.83%). But here's the twist that has my attention: while price action suggests a potential reversal, the derivatives market is screaming a different story entirely.
On the surface, FOGO's chart looks like it could be lifted straight from a technical analysis textbook. The token cratered from $0.03545 down to $0.01996 - a gut-wrenching 44% plunge that likely liquidated countless over-leveraged longs. But around that $0.02000 level, something interesting happened.
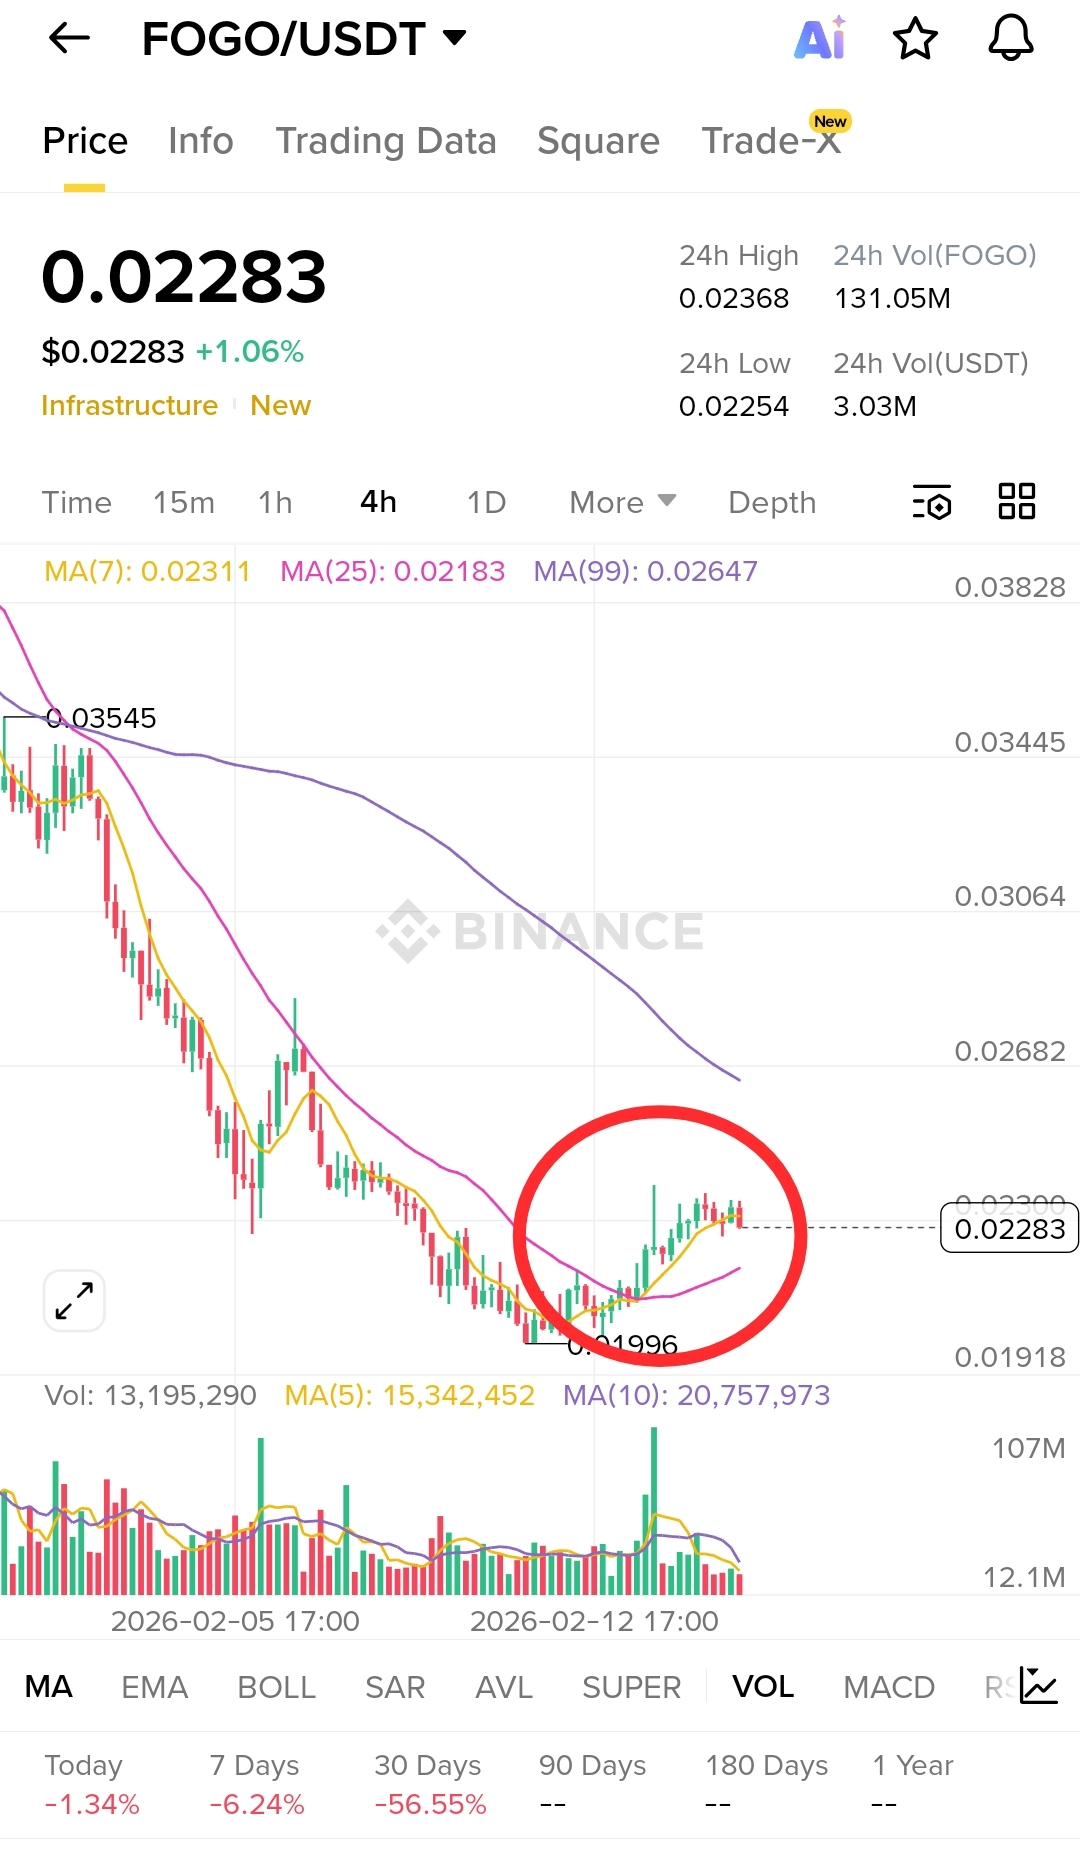
we're seeing now is a classic rounded bottom formation attempting to emerge from the wreckage. The 4-hour chart shows price consolidating around the $0.022-$0.023 range, with the 25-period moving average (currently at $0.02183) providing support. There's a modest uptick in buying pressure, and volume patterns suggest at least some accumulation is occurring.
The technical setup checks several bullish boxes:
Clear support established at the recent low
Higher lows forming since the capitulation wick
Price reclaiming the 25MA after being underwater
Decreasing selling pressure on each retest of support
But before you rush to ape into this "discount opportunity," let's examine what the smart money is actually doing.
Open Interest Has Surged to 217.8M
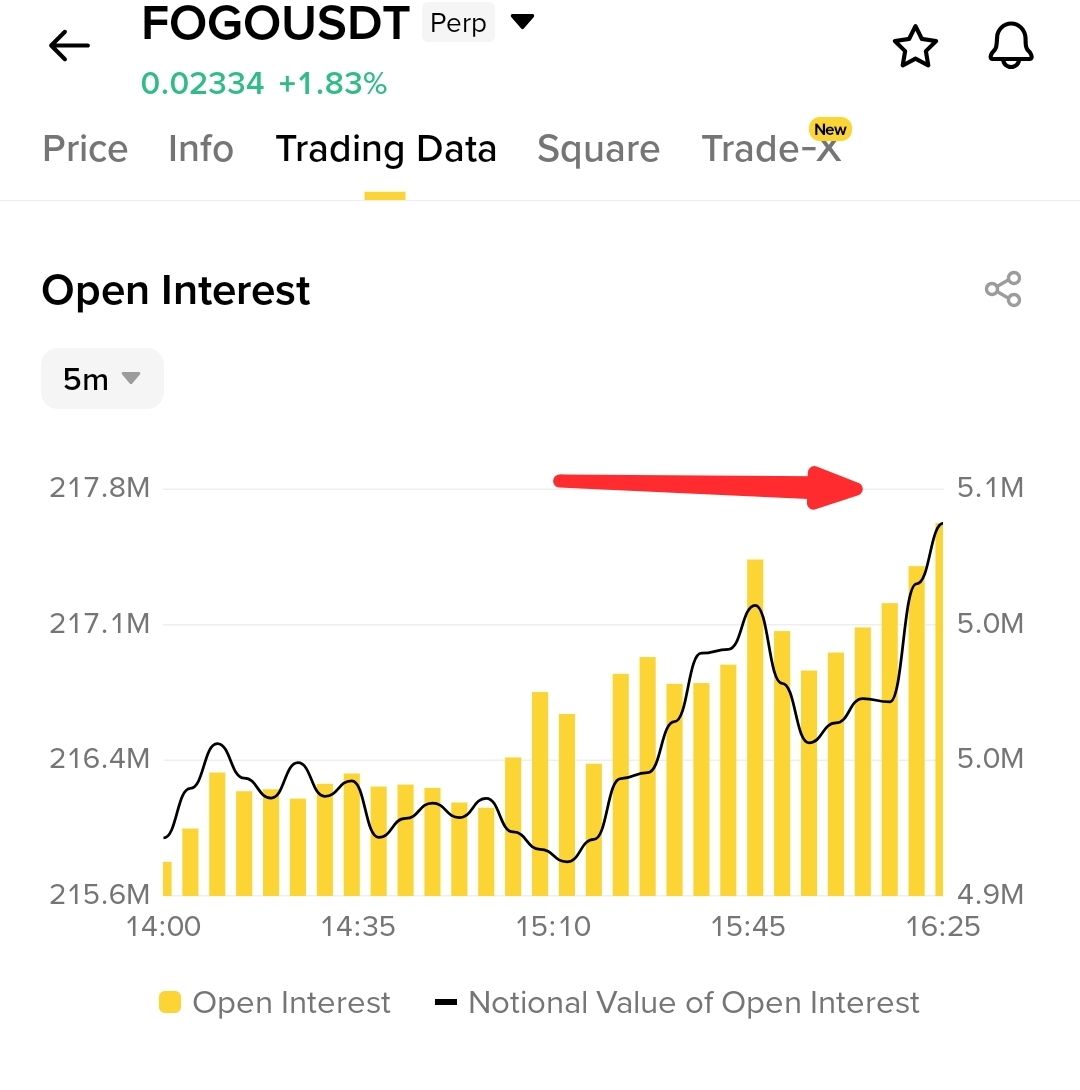
The red arrow on the Open Interest chart tells a story of conviction. We're not seeing OI slowly creep higher - it's spiking. Between 14:00 and 16:25, open positions jumped from around 215.6M to 217.8M, with the most dramatic increase occurring right as price attempted its bounce.
When OI rises alongside price in a perpetual futures market, it typically signals new positions being opened. The question is: are these longs or shorts?
71.44% Short vs. 28.56% Long - The Market Has Spoken
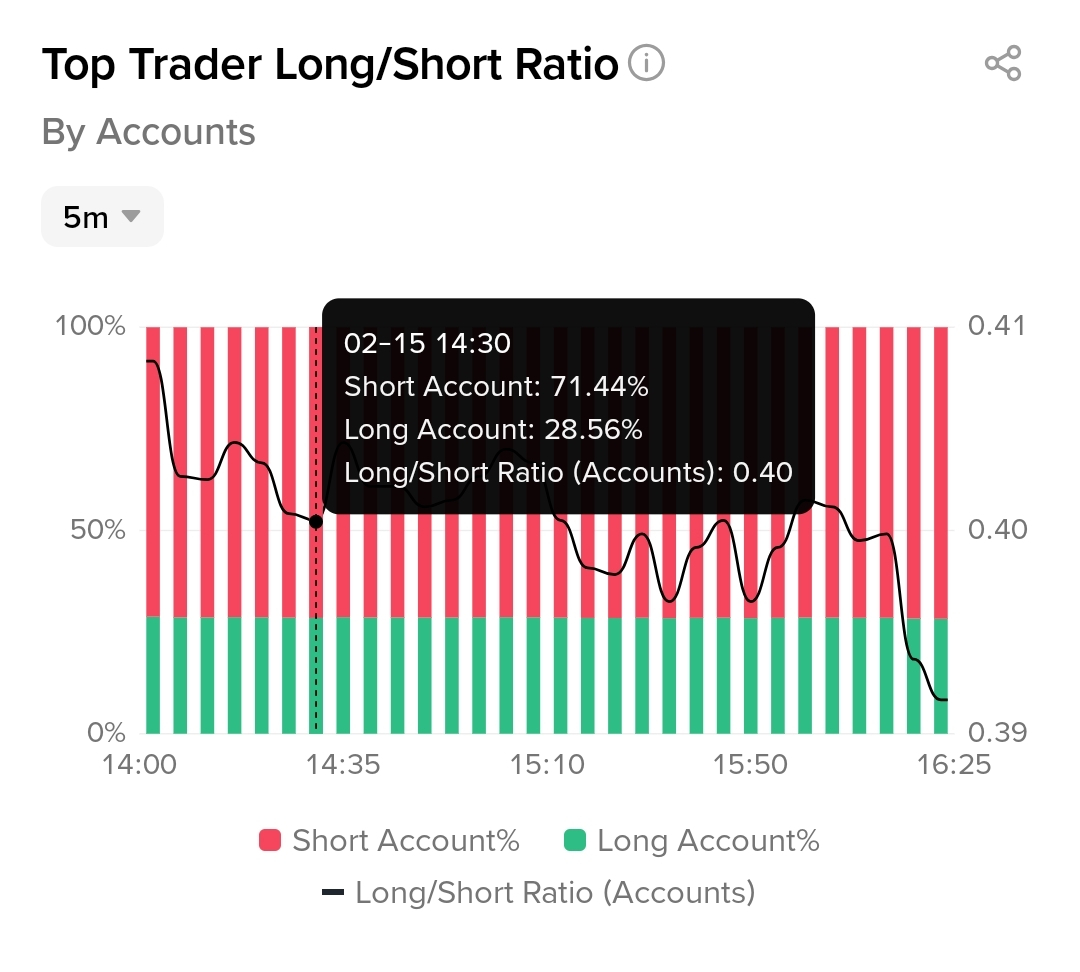
And here's where the narrative falls apart for the bulls. The Long/Short ratio by accounts sits at a dismal 0.40, meaning traders are overwhelmingly positioned for continued downside. At the 14:30 timestamp captured in the data, shorts outnumbered longs nearly 3-to-1.
What makes this particularly noteworthy is the timing. These short positions aren't legacy bearish bets from the top they're being opened NOW, during the bounce. Sophisticated traders are using this relief rally to add to short exposure, not cover existing positions.
The Basis chart shows the futures price trading at a slight premium to the spot index, with the spread oscillating between negative and neutral territory throughout the session. Currently, we're seeing futures at $0.02334 with the basis compressed near zero.
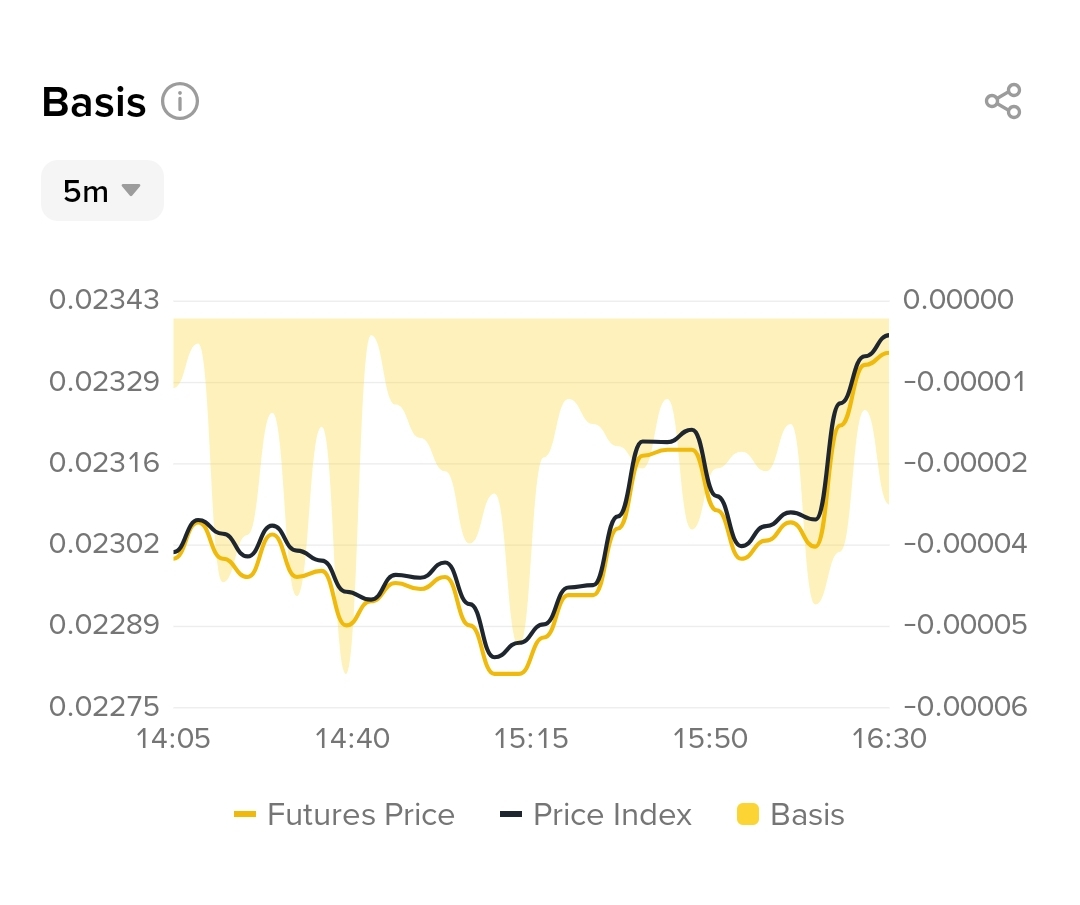
In normal market conditions for a healthy asset, you'd expect to see positive carry (contango) due to funding costs and time value. The fact that FOGO's basis keeps dipping negative (backwardation) suggests spot selling pressure exceeds futures demand typically a sign that holders are eager to exit.
The most recent spike in futures price above the index around 16:30 coincides with that surge in open interest, further confirming our thesis that fresh shorts are being initiated at these levels.
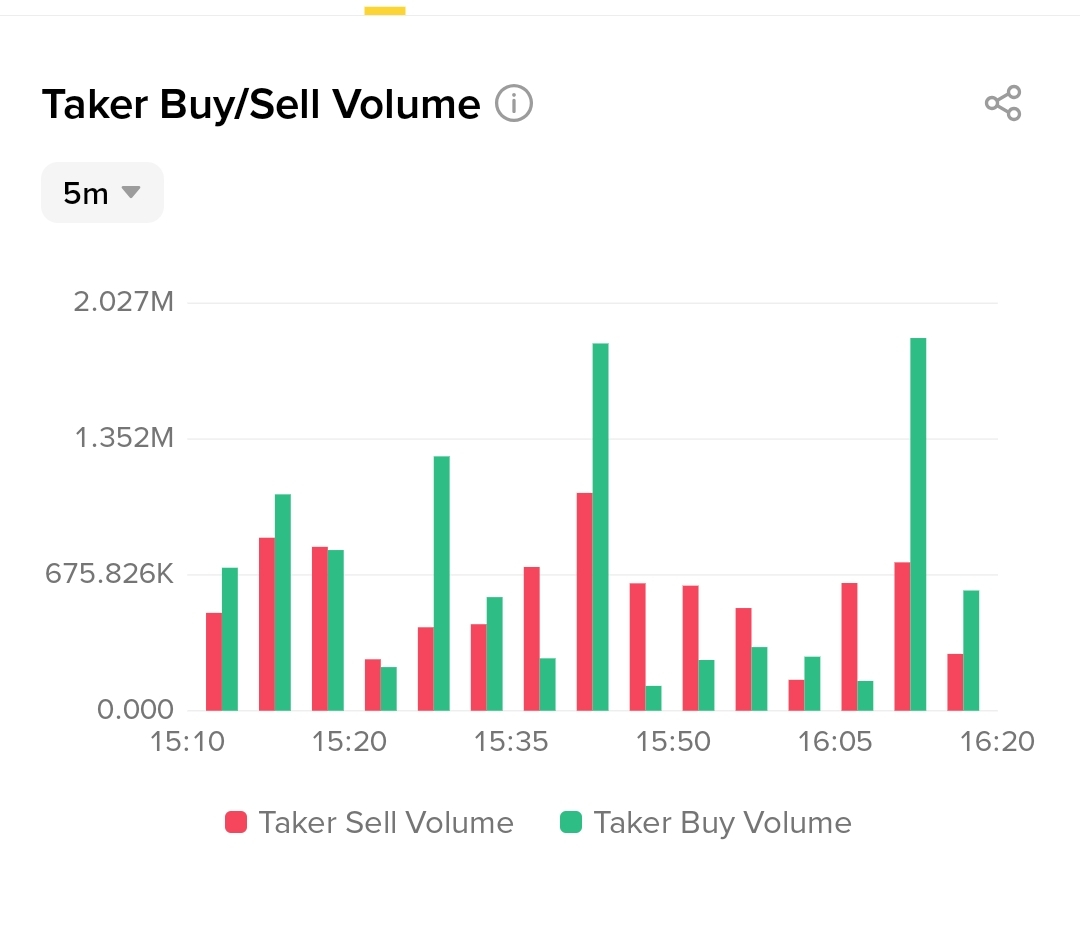
Perhaps the most telling indicator is the Taker Buy/Sell volume distribution. Looking at the data from 15:10 to 16:20, we see a fascinating pattern:
Green bars (taker buy volume market orders lifting offers) have consistently exceeded red bars (taker sell volume - market orders hitting bids) in several key periods. The largest taker buy volumes occurred around 15:40 and again at 16:15, reaching approximately 1.9-2M.
Despite this aggressive buying, price has barely moved. The taker buy pressure at 16:15 pushed FOGO from roughly $0.023 to $0.02334 - a measly 0.14% gain despite nearly 2M in aggressive market buy orders. This suggests massive sell-side liquidity is waiting at these levels, absorbing all buying pressure.
Contrast this with the taker sell volume spikes earlier in the session, which caused much larger percentage moves to the downside. The asymmetry is stark: it takes enormous buying pressure to move price up fractionally, while modest selling creates outsized downward moves.
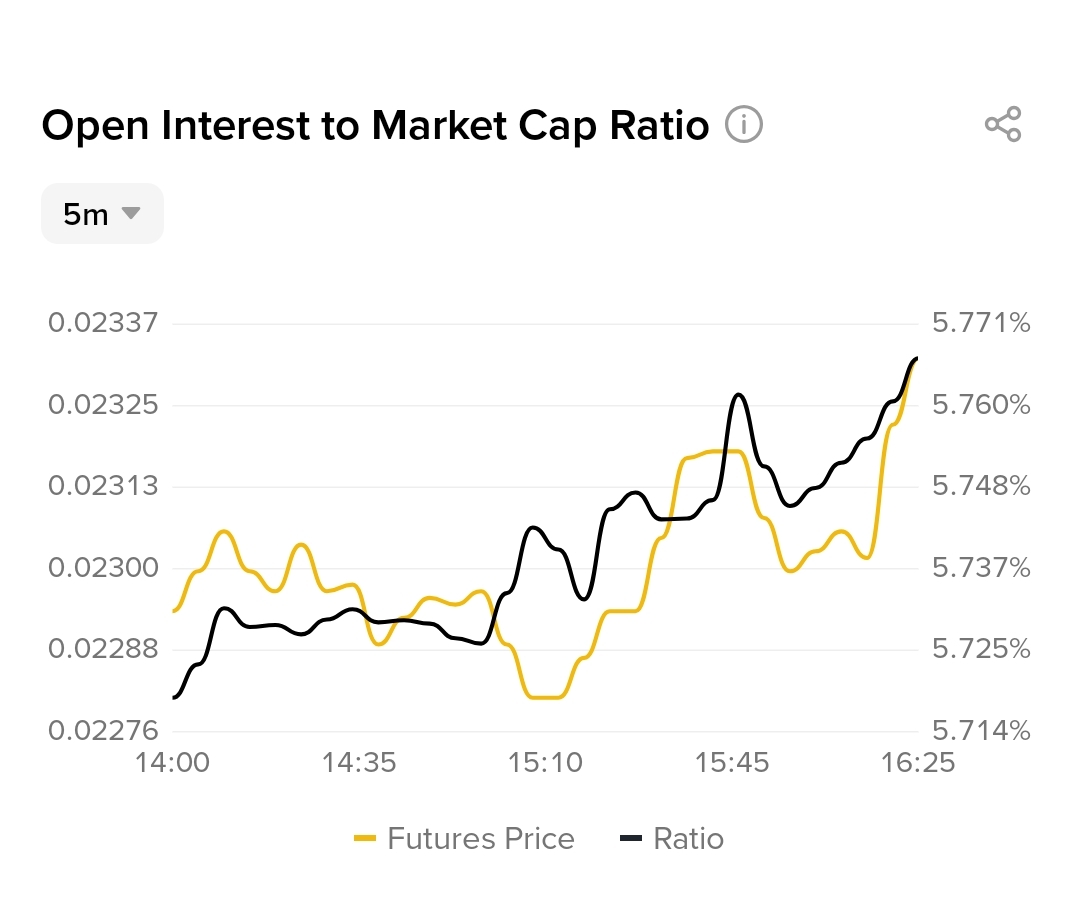
Open Interest to Market Cap: A Leverage Powder Keg
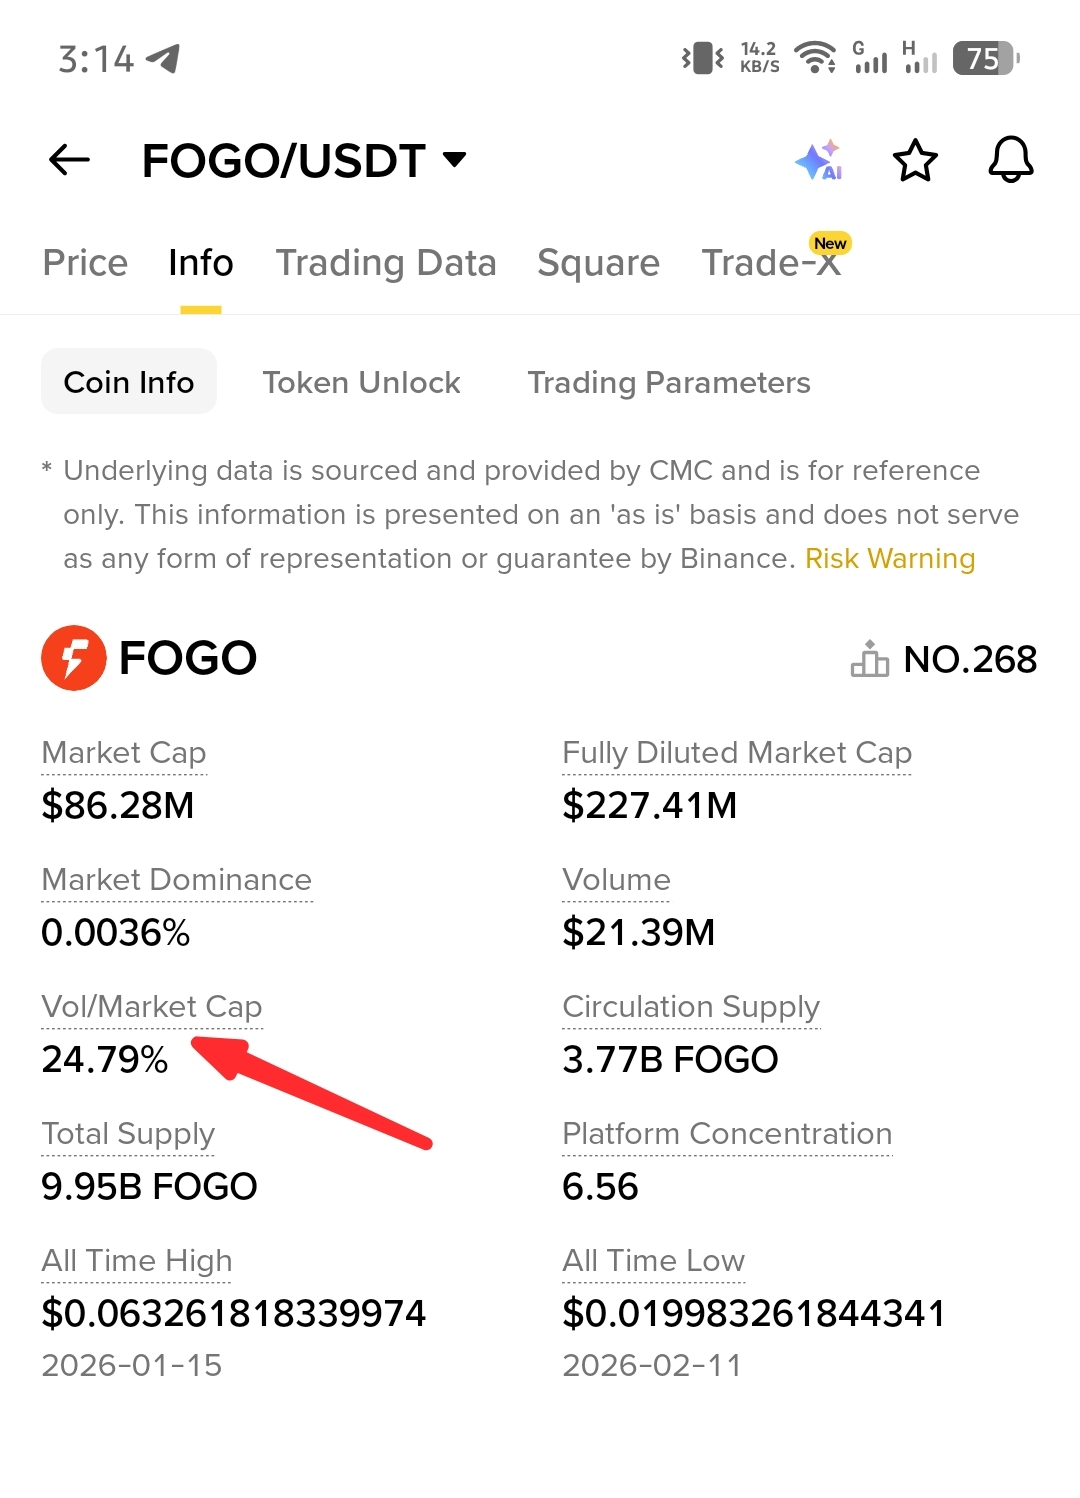
The OI/Market Cap ratio has climbed to 5.771% - dangerously high for such a small-cap, newly listed token. This metric tells us that nearly 6% of the entire market capitalization is currently locked in open derivative positions.
For context, established cryptocurrencies typically see OI/MC ratios between 1-3%. Anything above 5% suggests a highly leveraged, speculative market where violent moves in either direction become increasingly likely.
With this much leverage in the system and positioning so heavily skewed short, we're essentially looking at a loaded spring. The question isn't whether it will release violently - it's in which direction.
Now, I know what some of you are thinking: "With 71% of accounts short, isn't this the perfect short squeeze setup?"
It's a reasonable question, and there's a non-zero probability of a violent short squeeze if:
A catalyst emerges - Infrastructure tokens can pump on partnership announcements, major exchange listings, or protocol launches
Price breaks above $0.02647 - The 99-period MA represents a critical resistance level. A decisive break could trigger stop-loss cascades
Funding rates turn extremely negative - If shorts pay longs significantly to maintain positions, it could incentivize squeeze attempts
The 30-day performance speaks volumes. Down 56.55% in a month isn't normal volatility - it's a structured unwind. Someone (or many someones) desperately wanted out, and that level of selling typically indicates insider knowledge of problems ahead.
The "New" and "Infrastructure" tags are red flags. These tokens often launch with inflated valuations, heavy insider allocations, and aggressive early tokenomics that favor dumps over pumps. Without knowing FOGO's vesting schedules and unlock calendar, we're flying blind into potential supply shocks.
Market structure favors bears. All three key moving averages (7, 25, and 99-period) show price below the longer-term trend. Bulls need to reclaim not just one resistance level but multiple before the technical picture improves.
Put yourself in a market maker's shoes for a moment. You're looking at:
Extremely one-sided positioning (71% short)
Rising open interest (new participants entering)
Low market cap (easy to manipulate)
Retail-heavy book (evidenced by account-based metrics)
The optimal strategy? Pin price in a range, collect funding on both sides, and wait for either:
A) Longs to capitulate, allowing a controlled drift lower
B) Shorts to get nervous, creating a brief squeeze opportunity before the next leg down
The consolidation we're seeing around $0.023 could be exactly this professional players keeping things range-bound while they position for the next major move.
The Volume Analysis: Retail Buying, Whales Waiting
Diving deeper into the volume characteristics, there's a troubling pattern. The 24-hour volume stands at 131.05M in FOGO and only 3.03M in USDT terms. This massive disparity suggests:
High token velocity (lots of FOGO changing hands)
Low dollar commitment (not much actual capital flowing in)
Potential wash trading or bot activity inflating numbers
Compare this to the taker volume data, which shows real human (or sophisticated bot) decision-making. Those 1-2M spikes represent actual conviction trades. The fact that they can't sustainably move price suggests the order book is packed with sell orders from much larger holders.
Realistic Price Targets: Where Could This Go?
Bear Case (70% probability):
Immediate support at $0.02254 fails
Retest of $0.02000 occurs within 48-72 hours
Break below $0.02000 opens the door to $0.018-$0.015 range
Target: $0.0180 (-23% from current)
Base Case (20% probability):
Consolidation continues in $0.022-$0.024 range
Slow grind higher over 7-10 days
Test of $0.02647 (99MA) meets strong resistance
Range-bound for weeks until a catalyst emerges
Target: $0.0240-$0.0260 (+-10% from current)
Bull Case (10% probability):
News catalyst triggers short covering
Break above $0.02647 with volume creates FOMO
Dead cat bounce to $0.030-$0.032 possible
Target: $0.0310 (+33% from current)
My Trading Blueprint (Not Financial Advice)
If I were trading this setup with house money I could afford to lose completely, here's how I'd approach it:
For Bears (Shorting the Bounce):
Entry: $0.0235-$0.0240 on strength
Stop: $0.0268 (just above 99MA)
Target 1: $0.0220 (risk/reward 2:1)
Target 2: $0.0200 (risk/reward 3:1)
Target 3: $0.0180 (risk/reward 5:1)
For Bulls (Catching the Knife):
Entry: $0.0220-$0.0225 on weakness
Stop: $0.0195 (below recent low)
Target 1: $0.0245 (risk/reward 1:1)
Target 2: $0.0265 (risk/reward 2:1)
Size: Half of typical position due to elevated risk
For Smart Money (Staying Sidelined):
Watch for either:
- Decisive break below $0.0200 (confirmation of continued downtrend)
- Break above $0.0265 with actual volume (potential trend change)
Wait for 3+ daily closes above/below key levels before entry
Opportunity cost of waiting is less than probability of catching a falling knife
Here's what keeps me cautious despite some intriguing technical setups:
Tokenomics are unclear - When do major unlocks occur? Who holds what percentage?
Project fundamentals are unknown - What does FOGO actually do? Is there real usage?
Team credibility is unverified - Anonymous devs? Doxxed team? Track record?
Market maker agreements - Is there committed liquidity, or could this gap viciously?
Exchange incentives - Is Binance just listing anything for fees, or did this pass due diligence?
In traditional markets, I'd never touch an asset where I couldn't answer these questions. Crypto has different rules, but ignorance of fundamentals dramatically increases risk.
FOGO/USDT presents a fascinating case study in the disconnect between price action and positioning. The chart suggests a bottom may be forming, but the derivatives market is screaming that smart money isn't buying it - literally.
When 71% of traders are leaning one direction, it can mean two things:
The crowd is right, and this continues falling
The crowd is about to get punished
Historical data on cryptocurrency futures suggests that extreme positioning skews often persist longer than contrarians expect. The market can remain irrational (or correctly rational) longer than you can remain solvent.
My base case? This is a relief rally in an ongoing downtrend. The path of least resistance remains lower until we see actual evidence of trend change - not just hope and technical indicators, but real buying pressure that can overcome the massive supply overhang.
That said, I'll be watching the $0.02647 level closely. A convincing break above it with volume could quickly shift probabilities and trigger the mother of all short squeezes. In this market, being dogmatically bearish or bullish is how accounts get liquidated.
What Happens Next?
The next 48-72 hours are critical. Watch these levels:
$0.0240+: Resistance zone where shorts are likely adding
$0.0220: Support zone where bulls need to hold
$0.0200: Psychological level and previous low - break here is very bearish
And keep an eye on these indicators:
Open interest continuing to rise = more leverage = bigger eventual move
Long/short ratio flipping toward neutral = positioning reset
Taker buy volume sustainably exceeding sell volume = accumulation phase
Whatever happens, position sizing is crucial here. This is not an asset where you want to be overleveraged in either direction. The combination of low liquidity, high leverage, and unclear fundamentals creates an environment where 20-30% moves in hours are not just possible but likely.
sometimes the best trade is no trade. FOGO might be bottoming. It might squeeze. It might continue to bleed. But with this much uncertainty and this many unanswered questions, there are likely better risk/reward opportunities elsewhere in the crypto ecosystem.
If you do trade it, trade small, trade fast, and always have an exit plan.