$BTC Bitcoin’s weekly RSI indicator has dropped to levels reminiscent of the mid-2022 bear market, suggesting a deep pullback phase.
The market recently experienced liquidity squeezes — with both long and short positions taken out — due to thin trading volume (e.g., around the U.S. bank holiday).
Analysts point out similarities between the current RSI pattern and past cycle bottoms, where oversold RSI preceded longer consolidation before bottoming.
Weekly RSI readings dipping below ~30–28 are traditionally seen as oversold signals and can signal that selling pressure is exhausting — though they do not guarantee an immediate rally.
📊 What Analysts Are Saying About the Current RSI
RSI nearing deep oversold levels has been noted across multiple analyses, tying current momentum conditions to past cycle lows. Some traders interpret this as a sign of potential bottoming, while others warn momentum indicators can remain low as prices continue downward pressure.
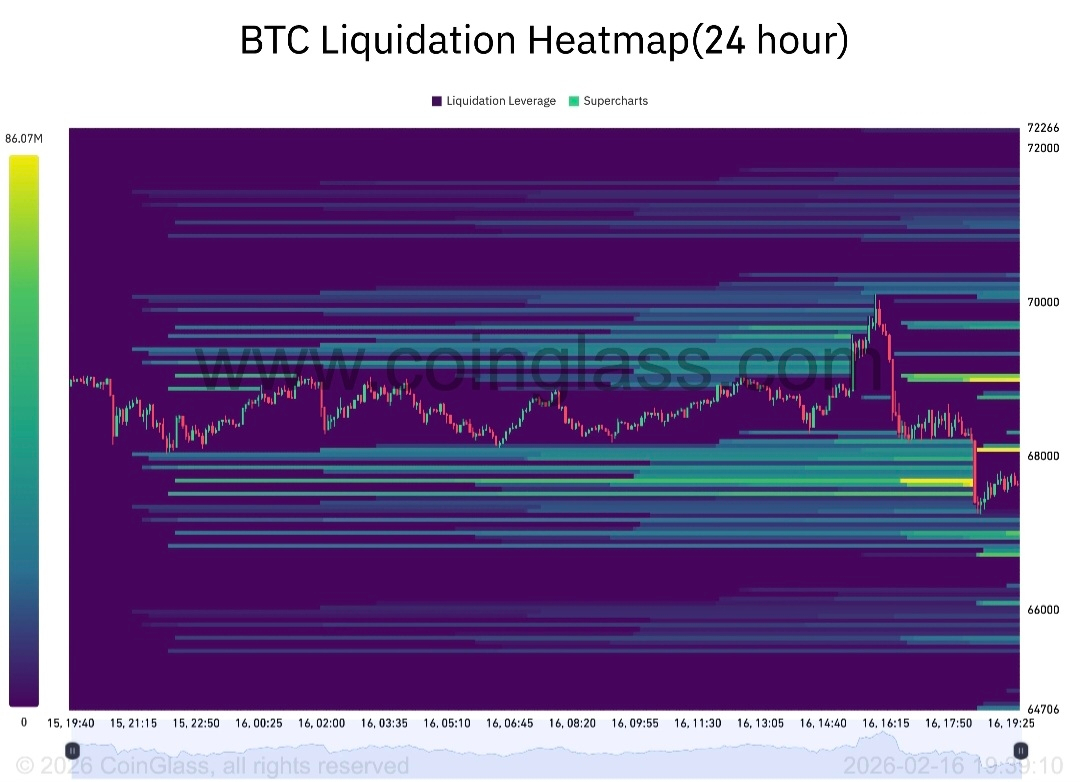
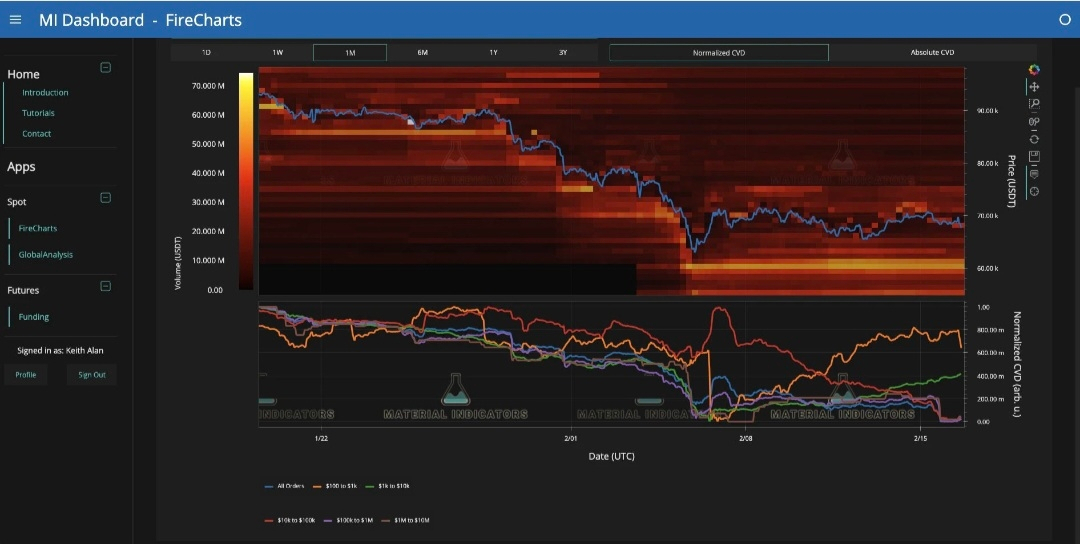
📌 Liquidity and Market Structure
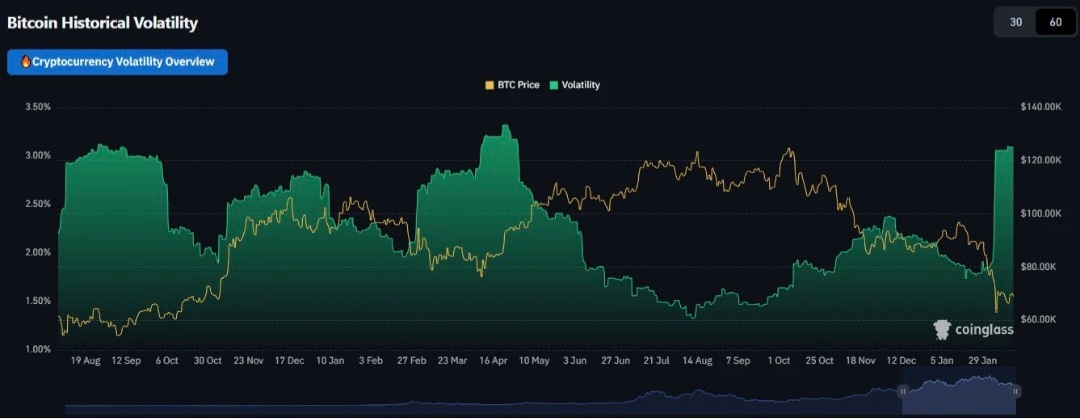
Broader technical analysis suggests $BTC price action still shows heightened risk and volatility, with some analysts pointing to tight liquidity and macro conditions as factors that could prolong market weakness.
📉 Other Indicators Weighing In
Some sources discuss fear and liquidity stress in the market (e.g., “Extreme Fear” sentiment, rising exchange inflows) that align with RSI weakness — indicating selling pressure and risk-off behavior.
🧩 What This Means (Not Investment Advice)
1. RSI, by itself, is a momentum indicator:
RSI shows how fast price changes, not a guarantee of reversal. RSI can remain oversold for extended periods, especially in strong downtrends.
2. Similar patterns happened before:
In 2022, weekly oversold RSI did not immediately trigger a price rebound; #BTC 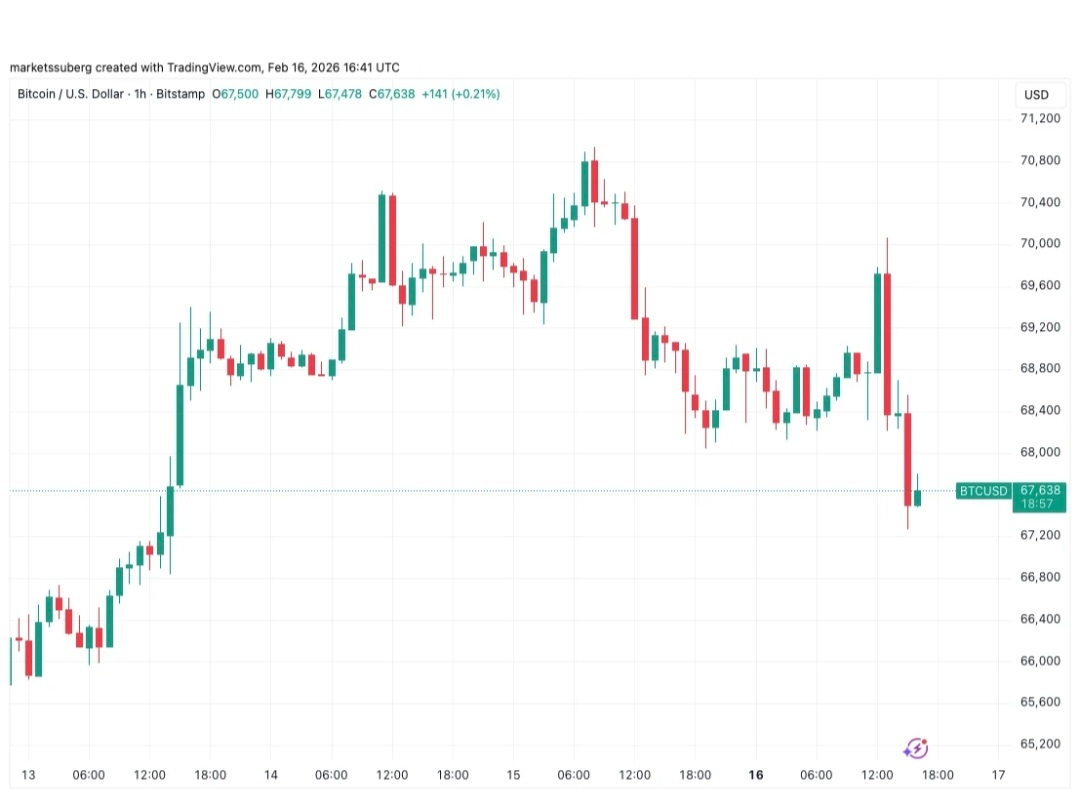
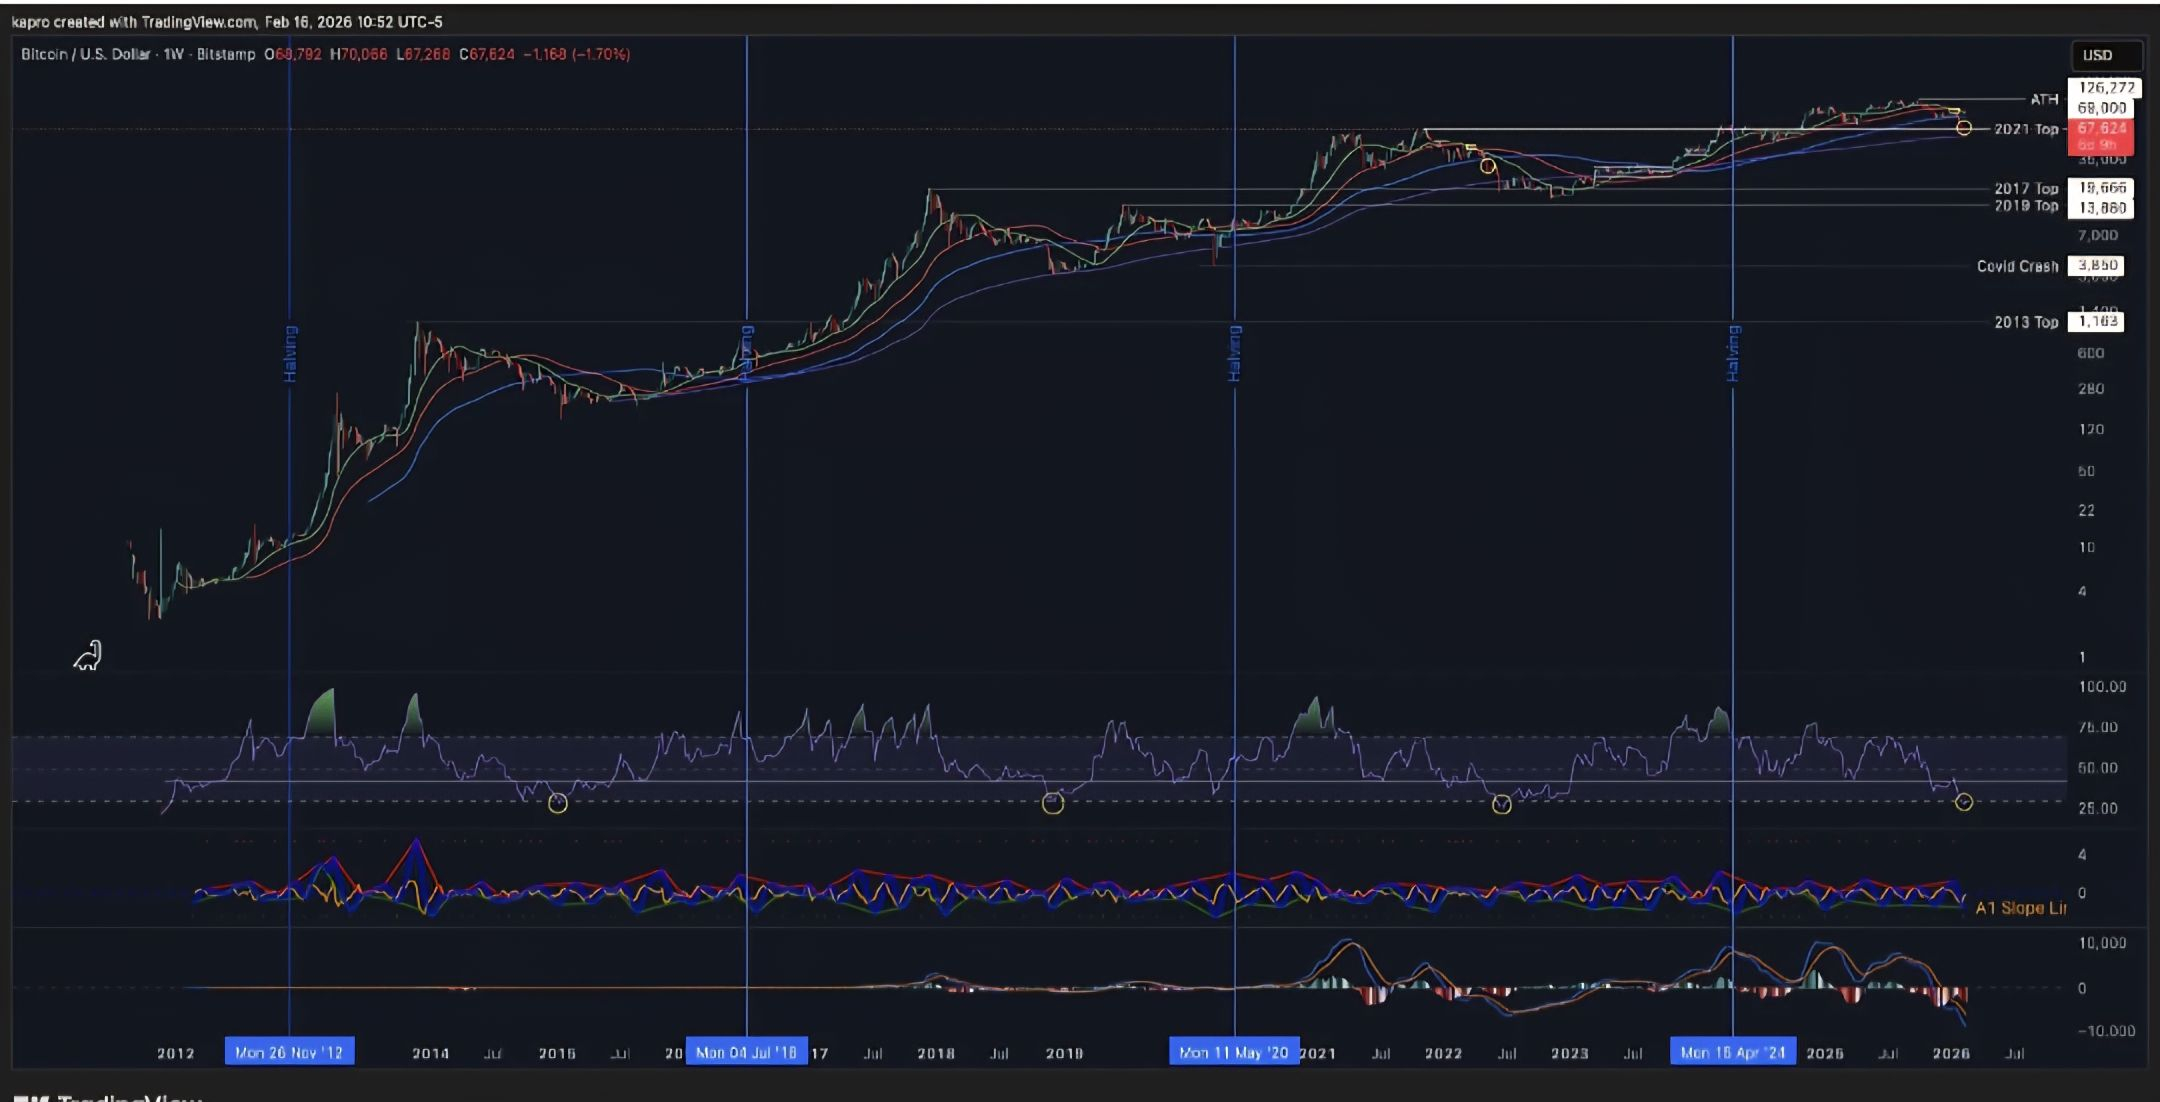 instead consolidated at lower levels for months before bottoming.
3. Combining multiple indicators is important:
Traders often look at liquidity metrics, macro sentiment, on-chain data, and broader trend signals alongside RSI to gauge real downside vs rebound risk.
📌 Summary
Bitcoin’s weekly RSI is at a deeply oversold reading similar to mid-2022 bear conditions — suggesting sellers may be exhausted, but not guaranteeing a turnaround.
Low liquidity and volatility spikes have led to sharp moves that shake out short- and long-term positions.
Historically, oversold weekly RSI can precede a bottom, but markets can remain weak or trade sideways for months before a sustained trend change.
Let me know if you want a short take on what current $BTC RSI levels mean for possible price targets or how traders use these signals to plan entries/exits.