Today I decided to ignore narrative and focus only on the chart. I opened VANRY/USDT on the 4H timeframe and asked myself a simple question: what is price actually telling me?
The Fear Index is at 12. That signals extreme fear. But the chart is not showing panic. And that difference matters.
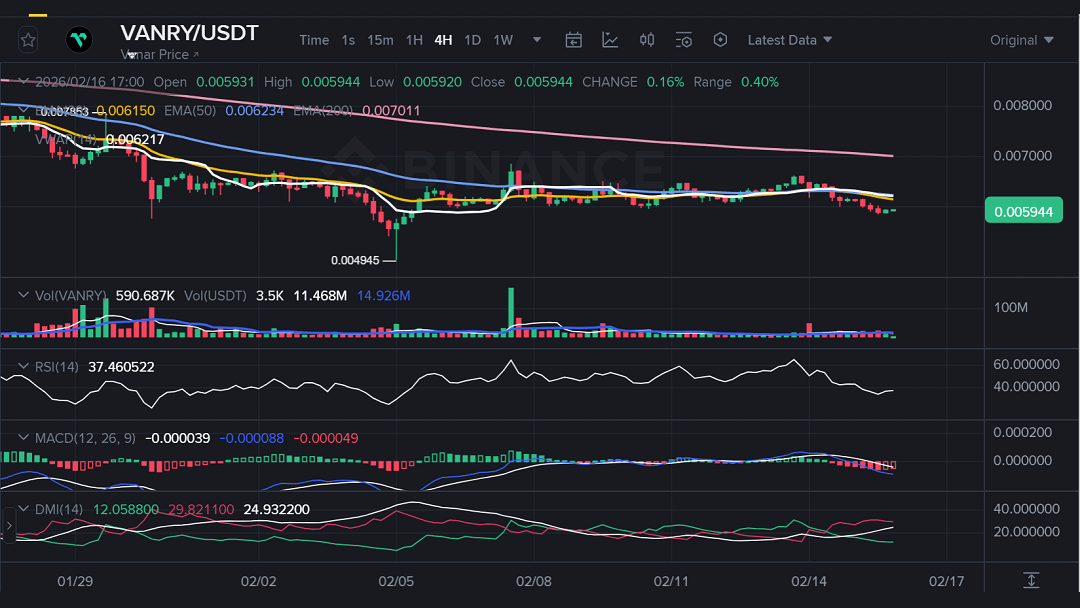
1. Market structure: active downtrend
The first thing I checked was structure.
Lower highs.
Price below EMA20 and EMA50.
EMA20 below EMA50.
Both below EMA200.
On 4H, that is a clear bearish structure. There is no ambiguity.
However, there is no aggressive acceleration either. After the drop toward 0.00494, price entered a weak consolidation phase. That usually signals technical pause, not confirmed reversal.
As long as price remains below the 0.0062–0.0063 zone with sustained closes, sellers remain in control.
2. Momentum: weakness, not capitulation
RSI is sitting around 37.
Not in extreme oversold.
Still room toward 30.
No clear bullish divergence.
That tells me bearish momentum is active but not exhausted.
MACD confirms this.
DIF below DEA.
Red histogram.
No bullish crossover yet.
Important detail: the histogram is not expanding aggressively. That suggests controlled pressure rather than panic selling.
3. DMI: trend confirmation
DMI reinforces the scenario.
DI clearly above +DI.
ADX above 20.
This means the downtrend is structurally valid, though not explosive.
In other words, this is not a collapse. It is steady bearish control.
4. Volume: the most interesting signal
The recent decline did not come with major volume expansion. There is no visible capitulation spike.
That usually suggests:
Gradual distribution.
Lack of aggressive buyers.
Possible slow accumulation phase.
When market sentiment is at extreme fear but volume does not show panic, sometimes we are closer to stabilization than breakdown.
Not always. But sometimes.
5. Probable scenarios
Bearish continuation: if 0.0058 breaks with expanding volume, the next logical test sits around 0.0055. If that level fails, 0.0049 becomes relevant again.
Technical reversal: for me to consider a real shift, I would need to see reclaim of EMA20, sustained closes above 0.0062, RSI moving above 45–50, and a bullish MACD crossover. Without those conditions, any bounce remains relief, not reversal.
Conclusion
The 4H chart is not giving an aggressive buy signal. It is also not showing full capitulation.
It is showing something more uncomfortable: structural weakness with potential slow accumulation.
In markets driven by extreme fear, gray zones often matter more than extremes.
Right now, VANRY is not strong. But it is not broken either.
And in technical analysis, that distinction changes everything.
@Vanarchain $VANRY #Vanar #vanar
This content reflects personal analysis and is not investment advice. Markets involve risk. Always conduct your own research (DYOR).