Markets rarely repeat perfectly, but they often rhyme. When we step back and compare previous market structures with the current one, an interesting pattern begins to emerge in Bitcoin’s price behavior.
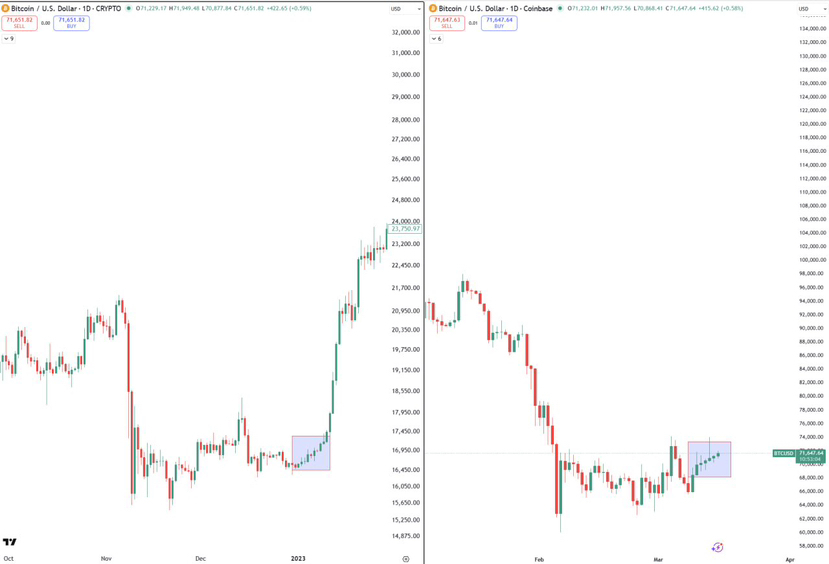
The chart above compares two different periods of Bitcoin’s market cycle. On the left side, we see the price structure that formed in late 2022 and early 2023. On the right side, we see the current market environment.
At first glance the price levels are completely different, but the structure underneath looks surprisingly similar.
The 2023 Setup
In late 2022, Bitcoin experienced a sharp decline followed by a period of exhaustion. After the panic selling phase ended, the market entered a quiet consolidation zone.
Price moved sideways for weeks.
During that period, most traders assumed the market was simply ranging before another leg down. Sentiment was still extremely bearish, and many participants expected further downside.
But something different was happening beneath the surface.
Selling pressure was gradually fading, volatility was compressing, and buyers were quietly absorbing supply. The market was building a base structure.
Eventually, once enough supply was absorbed, Bitcoin broke out of the range and began one of the strongest recovery rallies of that year.
The Current Market Structure
Now look at the right side of the chart.
After a strong correction earlier this year, Bitcoin again entered a sideways consolidation zone. Price has been slowly stabilizing, forming higher lows inside a tight range.
Just like the previous cycle, the market currently feels uncertain. Traders are debating whether this is simply a pause before another drop or the beginning of a recovery phase.
From a structural perspective, the pattern resembles the earlier setup:
Sharp decline → sideways compression → gradual stabilization.
This type of market behavior often appears when the market is transitioning from distribution to accumulation.
Why Consolidation Phases Matter
Sideways periods are usually the least exciting part of the market. Volatility drops, momentum disappears, and many traders lose interest.
But historically, these quiet phases often play a crucial role.
They allow the market to:
• Absorb selling pressure
• Rebalance positioning
• Build a stronger base for the next move
Without these consolidation periods, sustainable trends rarely develop.
Sentiment vs Structure
One of the most interesting aspects of these setups is the difference between sentiment and structure.
During accumulation phases, sentiment usually remains negative. Many investors are still focused on the previous decline and expect more downside.
But price structure slowly begins to improve:
Lower volatility
Higher lows
Stronger support zones
This gradual shift often happens before the majority of the market notices it.
What Could Happen Next
Of course, markets never move in identical ways, and no pattern guarantees the same outcome.
However, when a familiar structure begins to form, it becomes a useful framework for observation.
If the current consolidation continues and buyers maintain control of the range, Bitcoin could eventually attempt another expansion phase similar to what followed the 2023 base formation.
The key point is not predicting an exact price target.
The real focus is recognizing that markets often move through cycles of panic, stabilization, accumulation, and expansion.
Right now, Bitcoin appears to be somewhere in the stabilization phase of that process.
And historically, that’s the stage where the next major move quietly begins to take shape.