📊 Fundamental / Flow Analysis
Sentiment around Bitcoin remains constructive as price trades near $73,650 during a recovery phase.
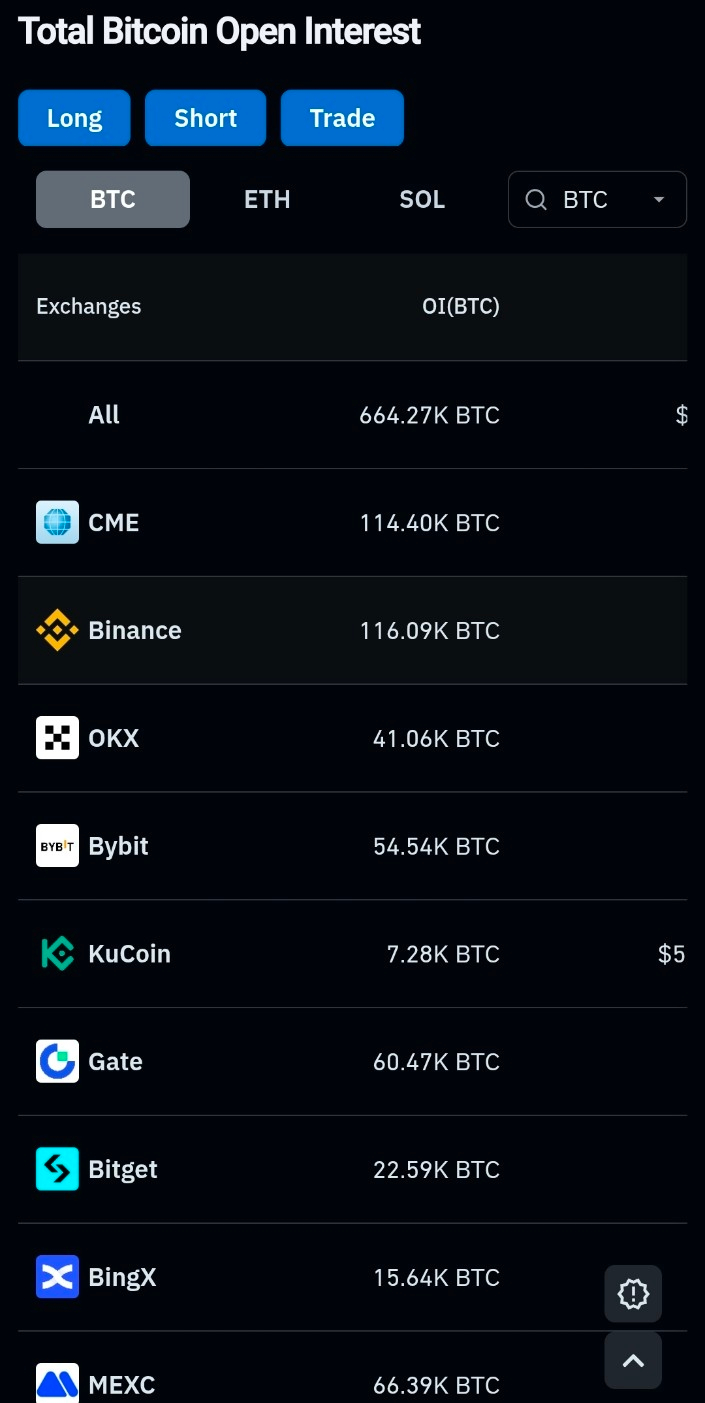
Derivatives exposure is extremely high with ~664K BTC open interest, showing heavy leveraged positioning. Institutional activity is visible through participation on Chicago Mercantile Exchange.
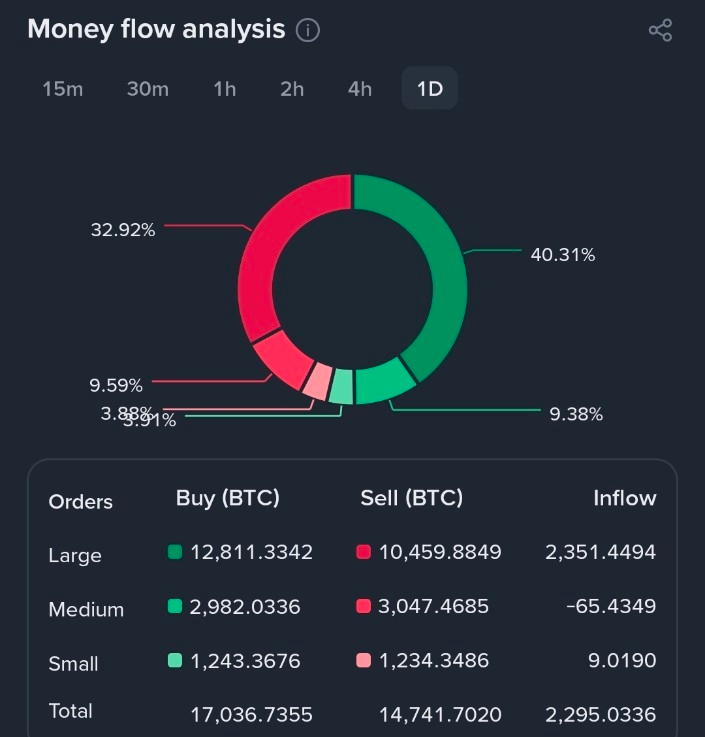
Order flow reveals whale accumulation, with large traders showing a net inflow of ~2,351 BTC, indicating strong capital entering the market.
📊 24H Market Information
24H trading volume reached approximately 16,641 BTC (~$1.20B).
Price traded between $71,263 – $74,330, producing about 4.2% volatility, typical during strong upward momentum.
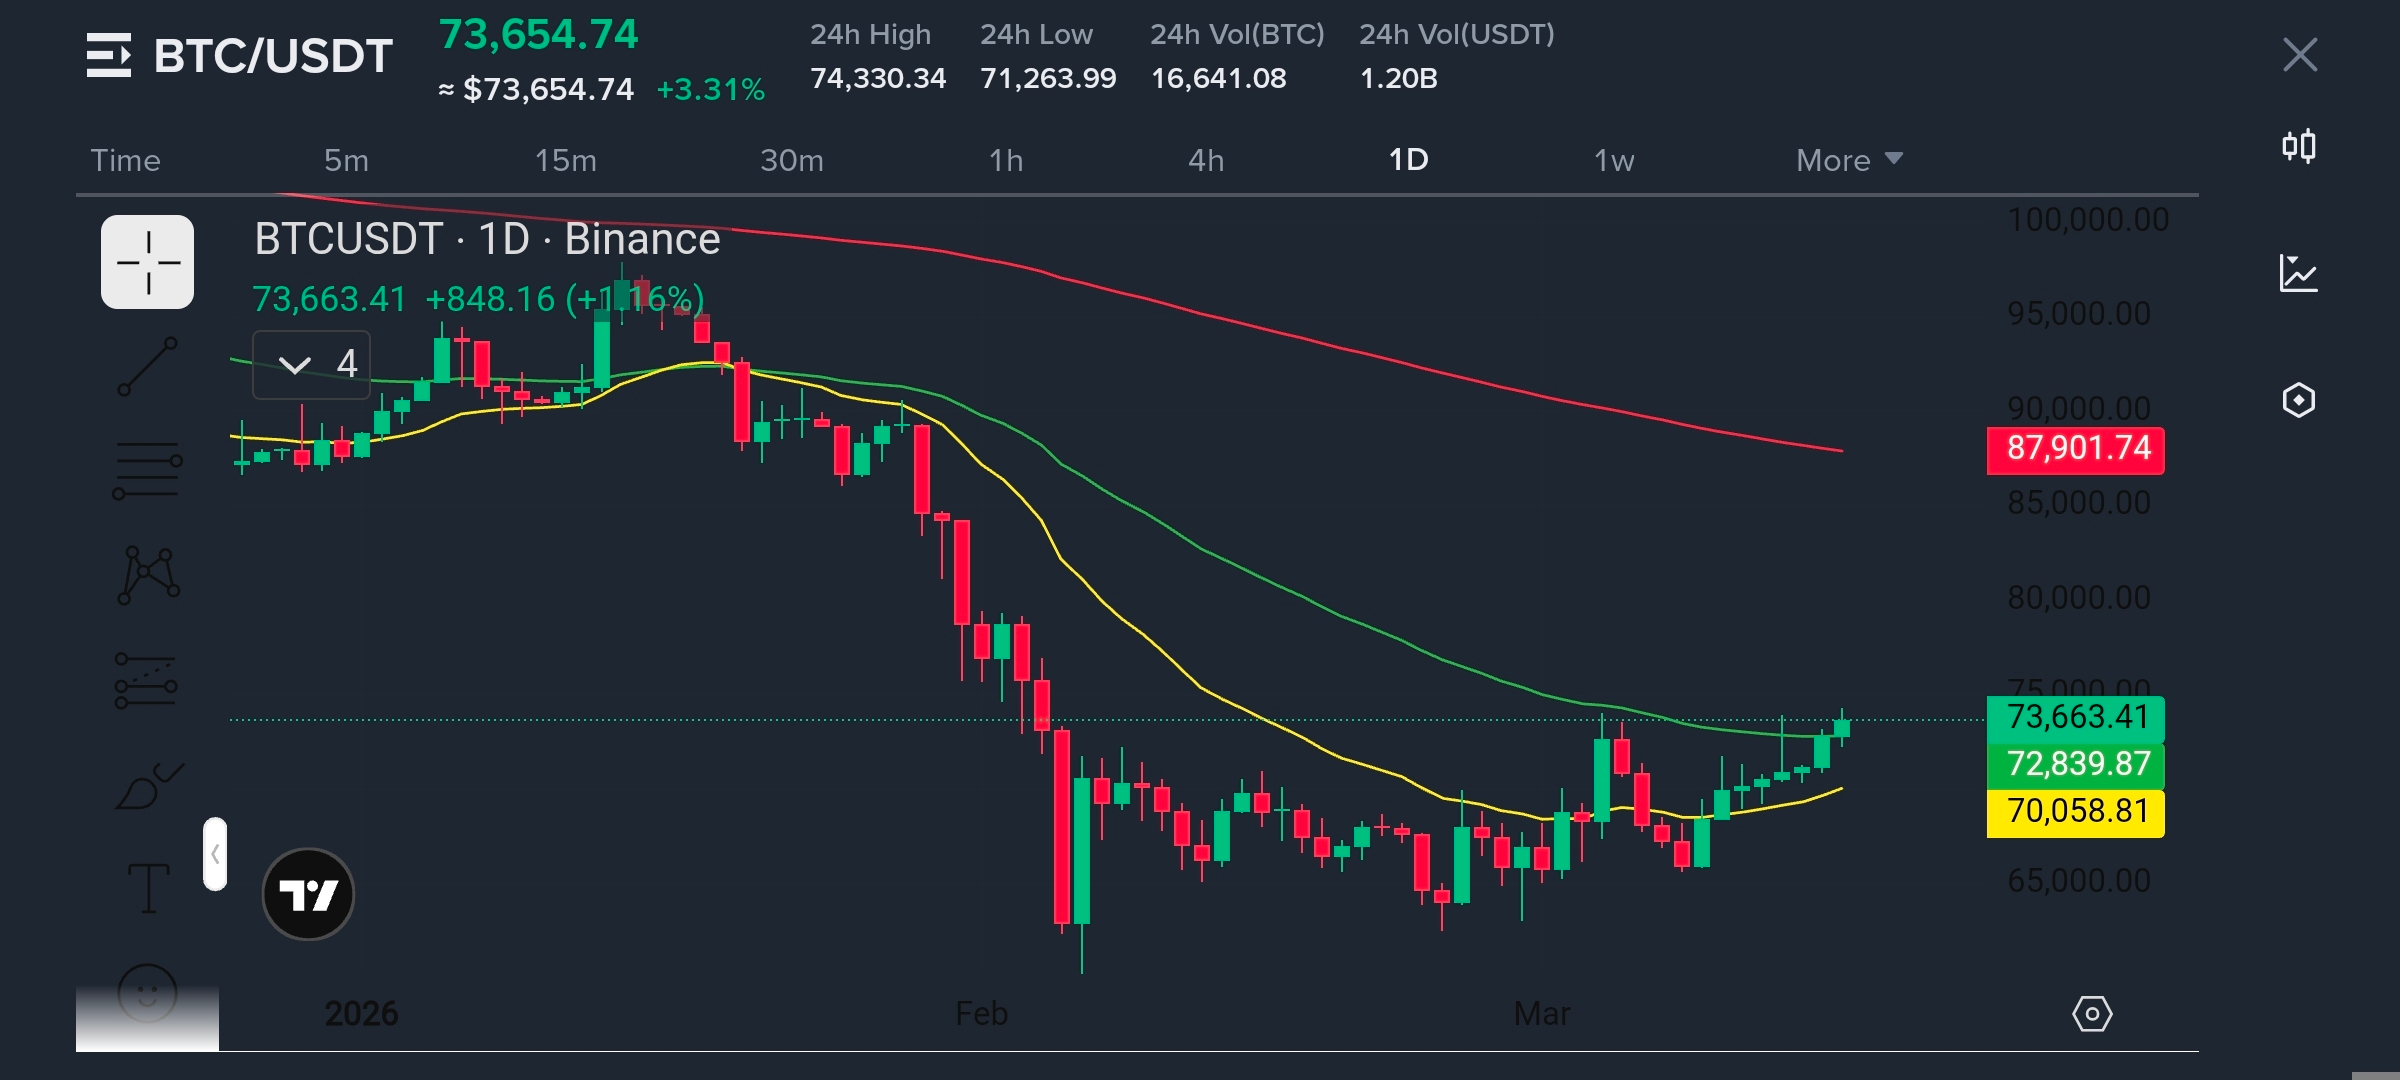
📊 1 Day Technical Analysis
The daily structure shows a recovery after a large correction.
Cycle structure:
• Correction from $100K region
• Bottom formation near $60K
• Gradual recovery trend
Moving averages:
• 20 MA ≈ $72,839
• 50 MA ≈ $70,058
• 200 MA ≈ $87,901
Price reclaiming the 20 MA signals a short-term bullish trend, although BTC remains below long-term resistance levels.
📊 4 Hour Technical Analysis
The 4H chart shows a clear bullish structure with higher highs and higher lows forming since early March.
Moving averages:
• 20 MA ≈ $71,434
• 50 MA ≈ $70,629
• 100 MA ≈ $70,475
Price trading above all averages confirms strong trend control by buyers.
📊 15 Minute Technical Analysis
Intraday structure shows a bullish breakout followed by consolidation.
Key levels:
• Support: $72,700
• Resistance: $74,300
Price remains well above short-term averages (~$72.7K), maintaining intraday bullish momentum.
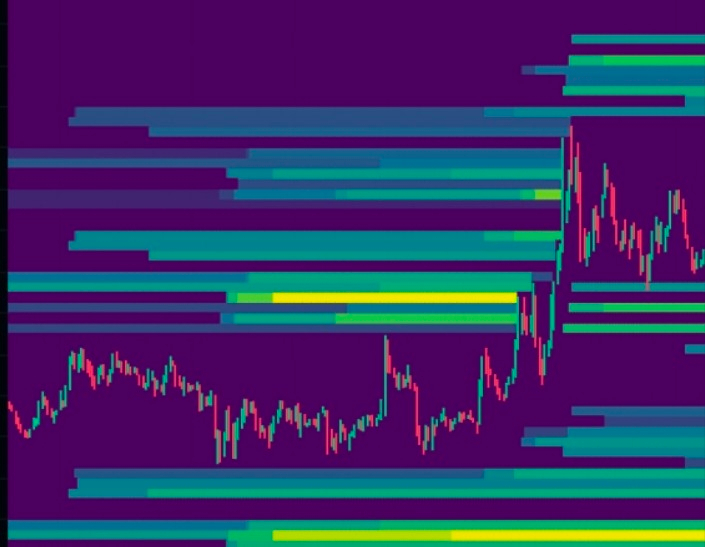
📊 Liquidity Zones
Above Price (Short Liquidations)
• $74,500 – $75,000
• $76,000
Below Price (Long Liquidations)
• $72,500
• $71,500
• $70,000
The closest liquidity magnet sits near $74.5K, making it the likely short-term target.
📊 Most Likely Scenarios
Scenario A (50%)
Liquidity sweep toward $74.5K
Then minor pullback
Targets: $75K → $76K
Scenario B (35%)
Dip first toward $72.7K liquidity
Then rebound
Targets: $74.5K
Scenario C (15%)
Break below $72K
Targets: $71K → $70K
Macro trend remains intact.
📊 High Probability Trading Zones
Long Zone
$72,700 – $73,000
Breakout Entry
Above $74,500
Targets
$75,500 → $76,000
Invalidation
Below $71,500
📊 Final Bias
Bias: Bullish