The current chart on Binance for BTC/USDT (or BTC/USD) indicates a classic post-peak correction phase in the ongoing Bitcoin cycle.
Observed Pattern:
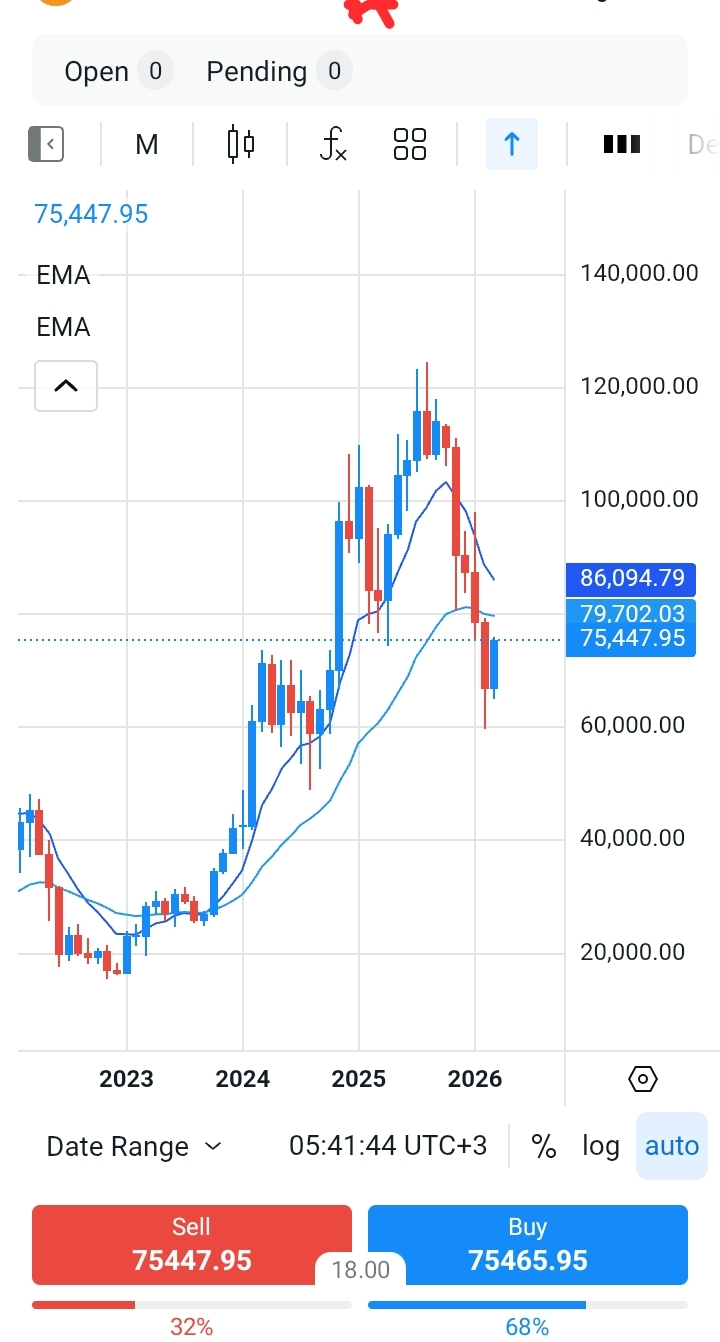
From 2023 to early 2024: Gradual recovery from lows around 20k-30k, with the blue EMA (long-term moving average) acting as support.
2024 to 2025: Strong parabolic bullish run, pushing past 100k, reaching an all-time high (ATH) around 126,000-130,000 in October 2025.
Late 2025 to now (March 2026): Sharp reversal with a series of red (down) candles. Price has broken below the blue EMA, entering correction territory. Current levels are testing around 75,000-75,400 (with recent trades fluctuating between ~74,600 and ~76,000 as of March 17, 2026, around 05:50 AM +03).
Key horizontal levels visible: 86,094 → 79,702 → current ~75,447 as support/resistance zones. The chart shows ~40-45% drawdown from the 2025 peak so far.
Historical Comparison:
This matches Bitcoin's typical halving-driven cycles:
2017 peak (~20k) → 2018 low (~3k): ~85% correction.
2021 peak (~69k) → 2022 low (~15k): ~77% correction.
Current (2025 peak ~126k) → 2026 ongoing: ~40% down so far, with historical patterns suggesting potential for deeper drawdown (50-80% total in past cycles), often bottoming in the 50k-60k range before recovery.
The pattern is a standard bull-to-bear transition after a post-halving euphoria phase, seen repeatedly in BTC (and sometimes in major alts like ETH).
Where It May Go Next (Based on the Chart):
Short-term (next few weeks/months):
Bearish bias persists — downward pressure likely if 75,000 breaks decisively. Next major supports at 65k-60k (previous consolidation/psychological level), with deeper potential to 55k-50k in a full cycle correction (aligning with past bear phases). Recent momentum shows some rebound (price surging past 75k recently with ~3-4% daily gains), but EMA break remains a bearish signal. The 68% buy pressure indicator often acts as a trap in downtrends.
Medium to long-term (late 2026/2027):
Bullish recovery expected after correction — Bitcoin cycles historically end corrections with new bull runs and higher ATHs. If 60k-65k holds as support, a push toward 150k+ (or higher) is possible in the next phase.
This is technical pattern analysis from the chart and historical data — markets remain volatile and unpredictable. Always manage risk, use stop-losses, and do your own research (DYOR) on Binance or other platforms. If you need details on specific indicators (RSI, volume, futures OI), let me know! 📊🚀