$BTC 📊 Bitcoin (BTC) Short Technical Analysis — Latest
🔎 Current Market Snapshot
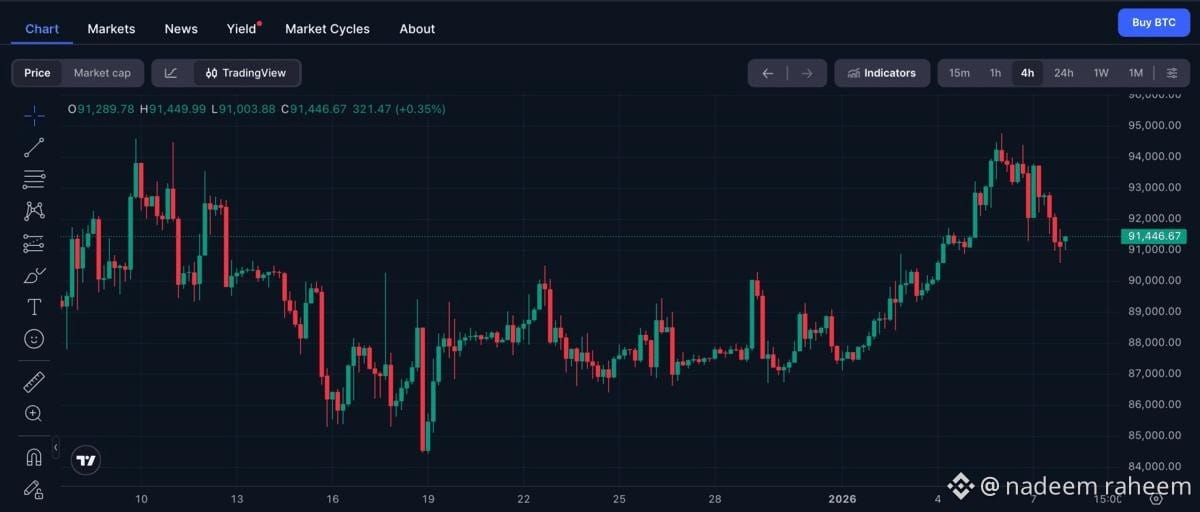
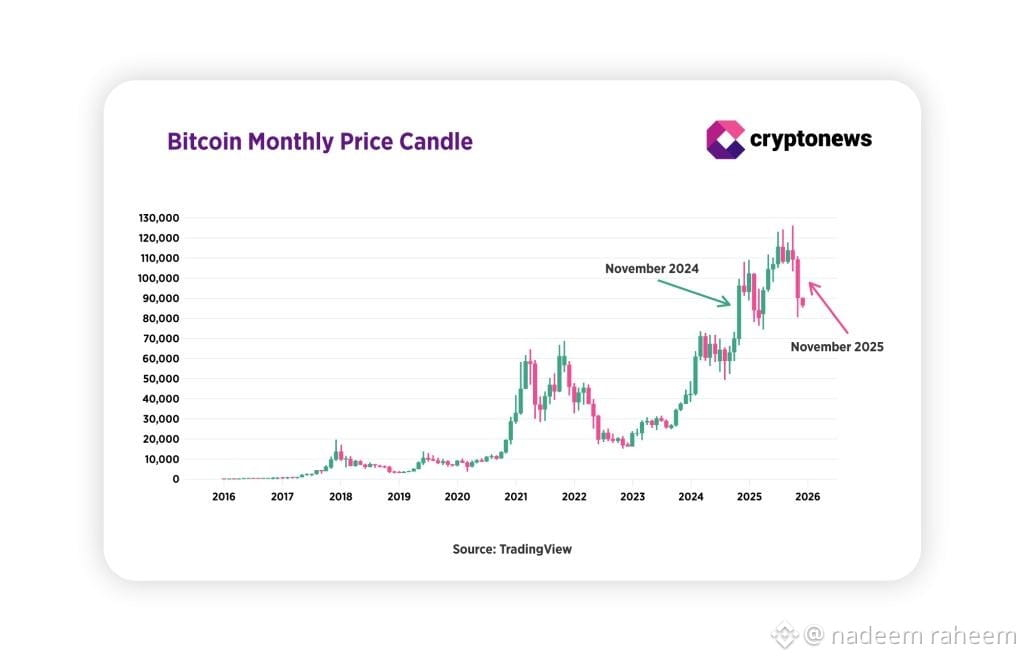
Price range: ~$68K – $74K recently (TradingView)
Trend: Short-term bearish / sideways consolidation
Market sentiment: Weak momentum, risk-off environment
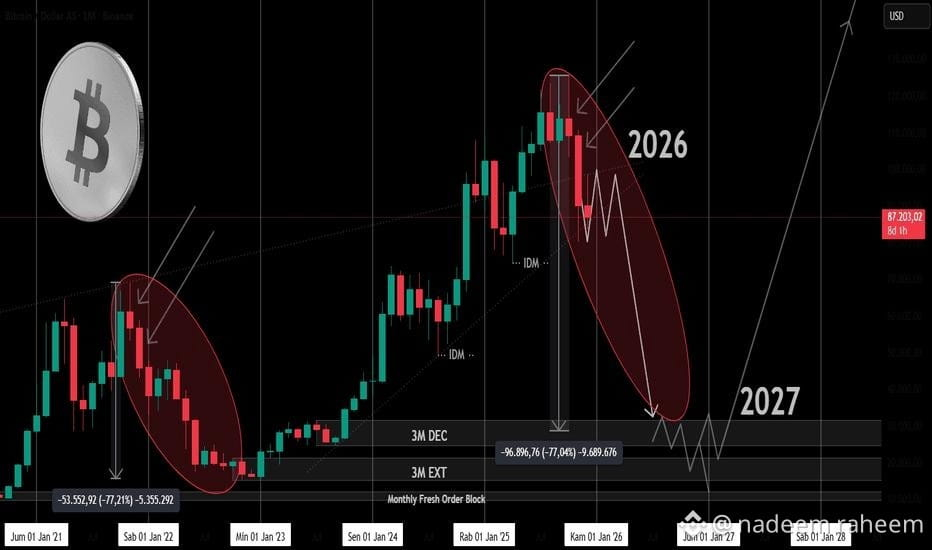
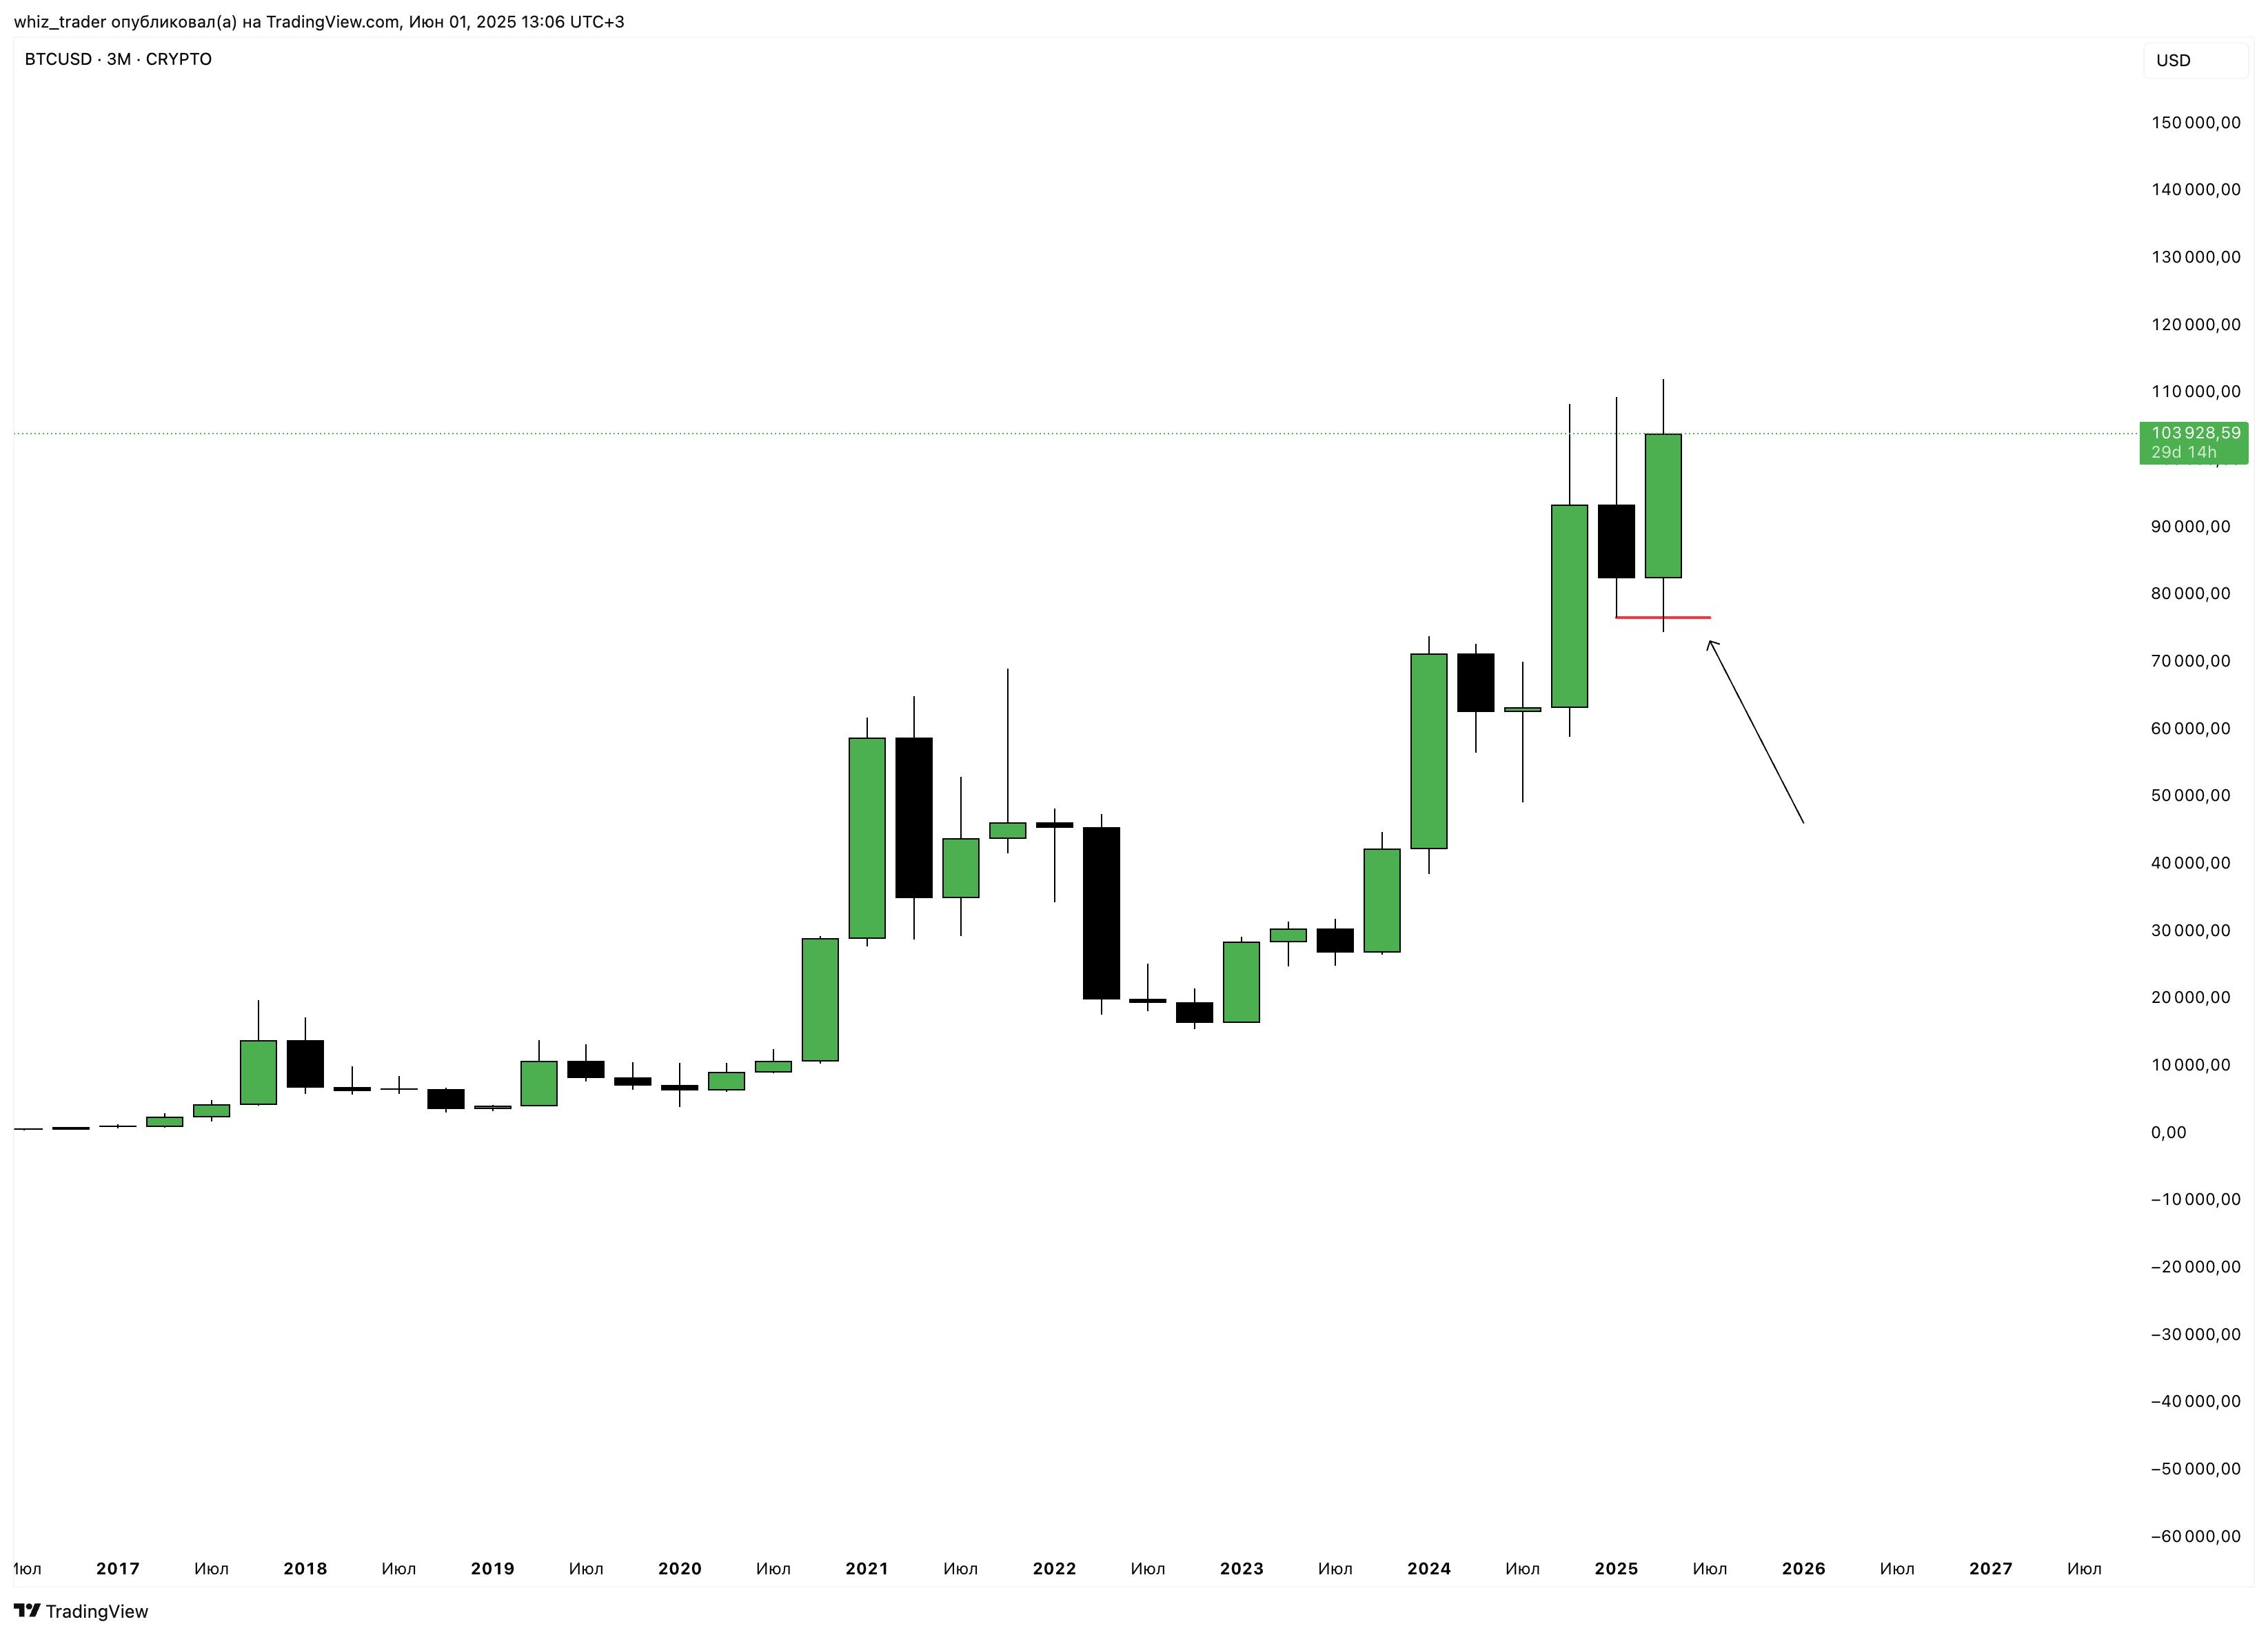
Bitcoin has been under pressure after dropping significantly from its late-2025 highs (~$120K+), with recent price action showing lower highs and weak rebounds. (Investopedia)
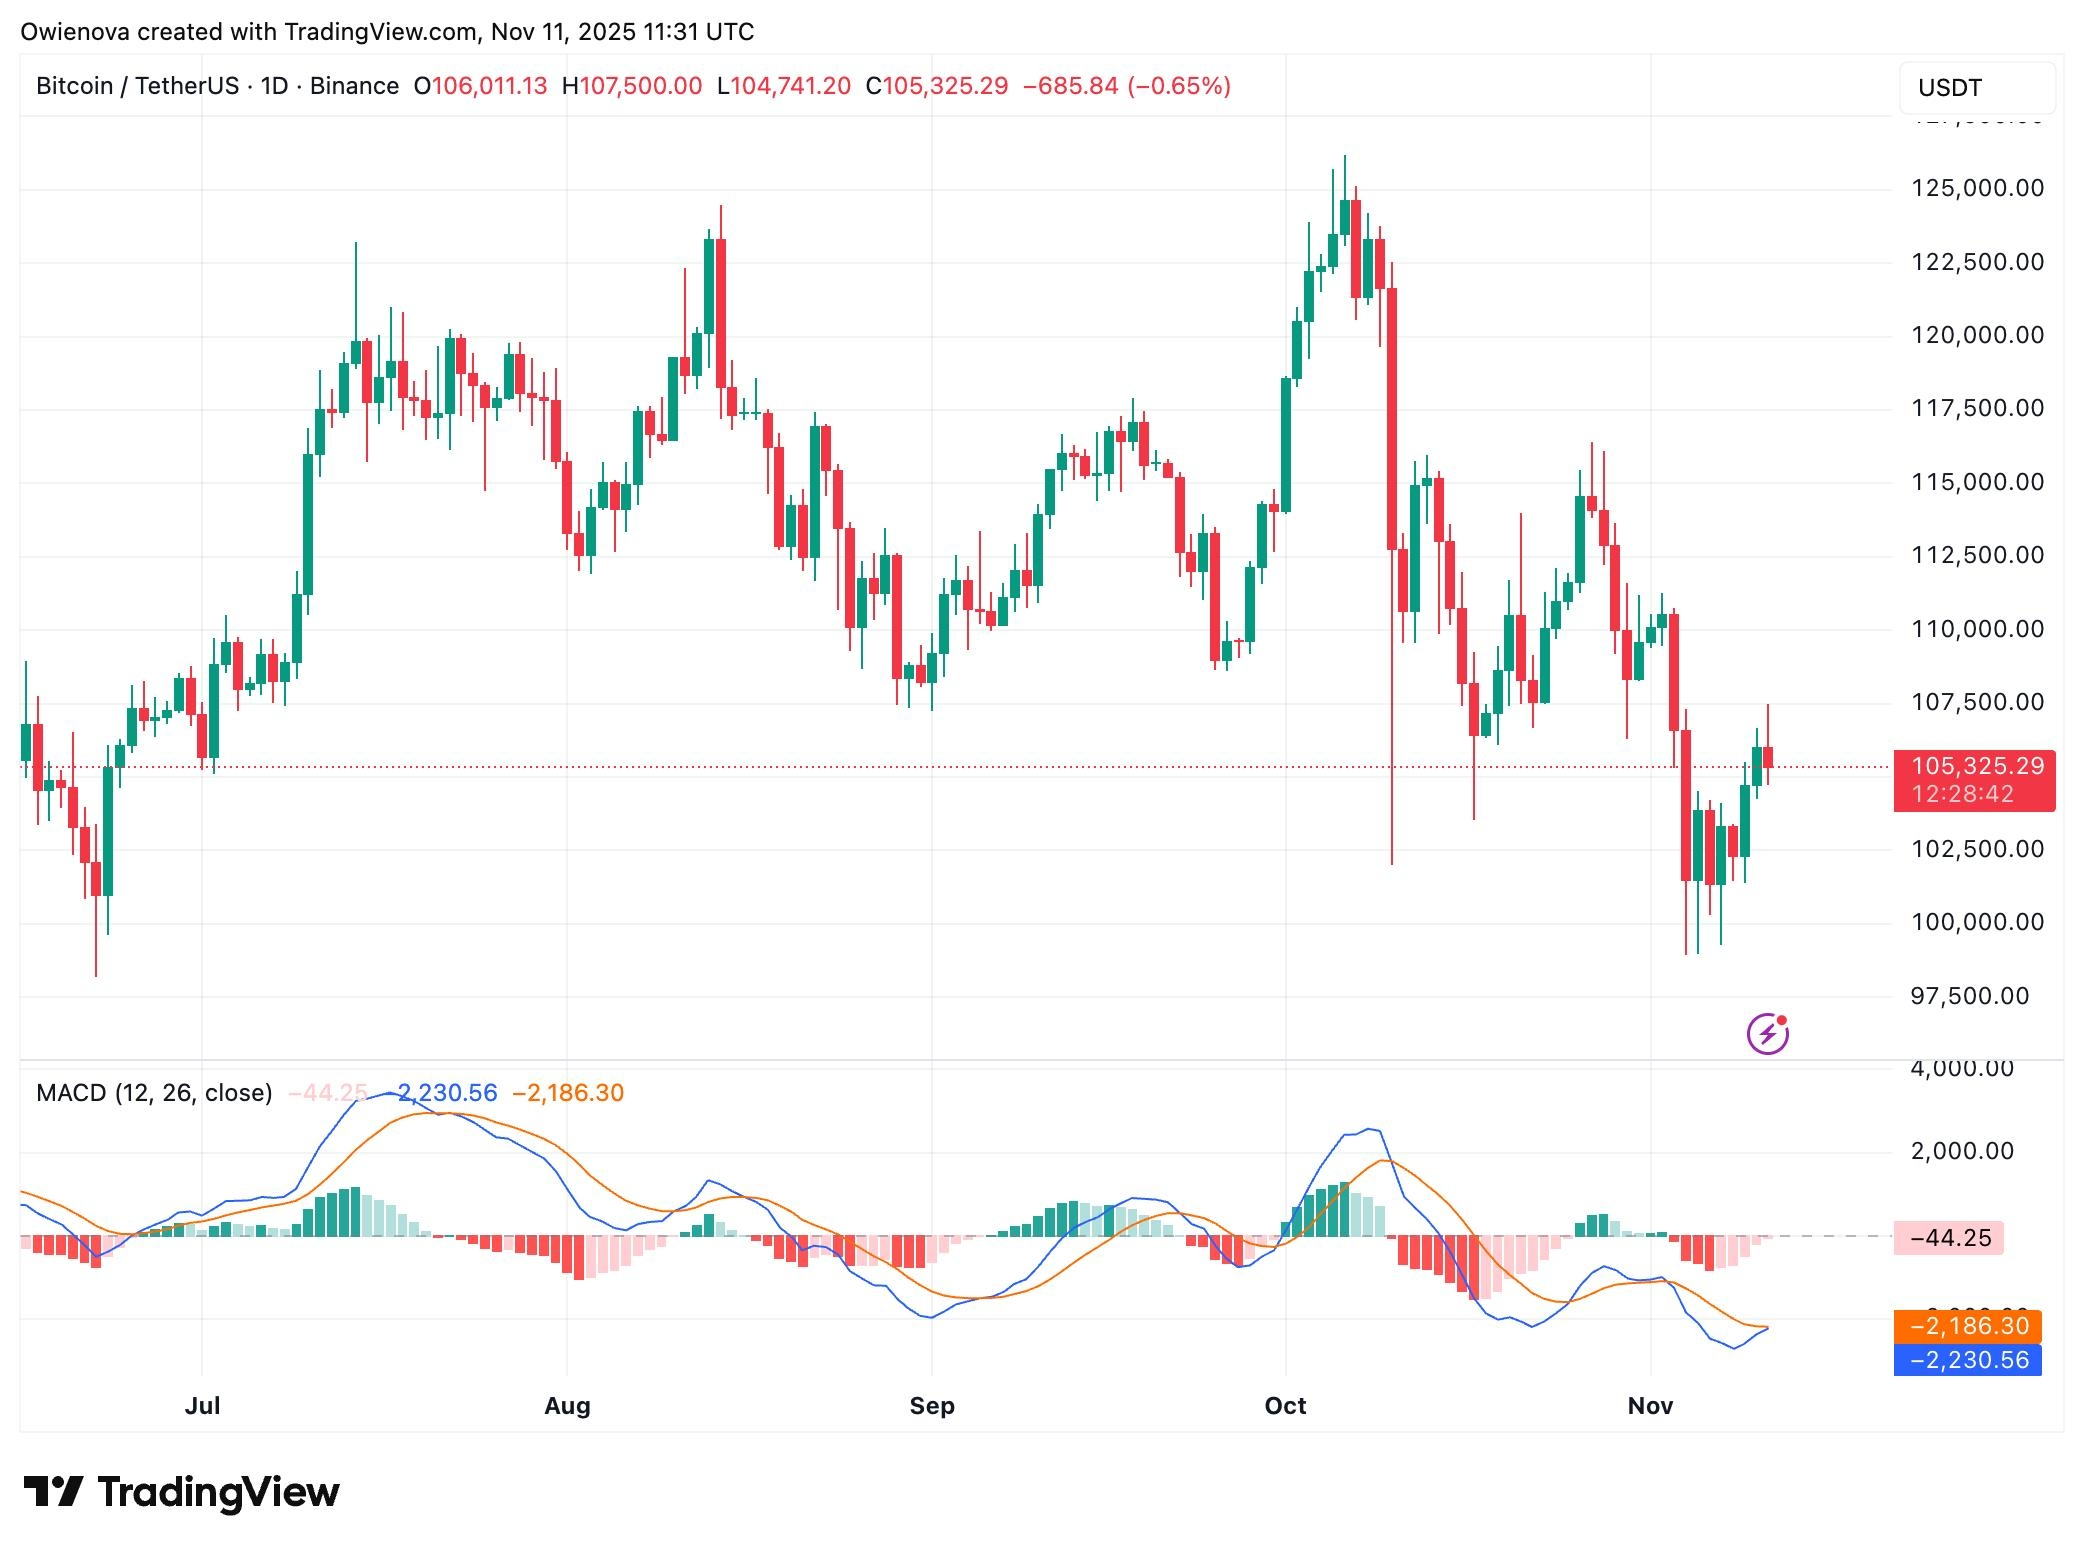
📉 Candlestick Analysis (Short-Term)
Recent candles show:
Long upper wicks → rejection near resistance
Smaller bodies / indecision candles → consolidation
Occasional bearish engulfing patterns on lower timeframes
👉 This suggests:
Sellers are active near resistance zones
Buyers lack strong follow-through
🔑 Key Levels to Watch
Resistance: $75K – $80K
Support: $65K – $60K
Breakdown below ~$65K could trigger deeper correction toward $60K or lower (Coindesk)
Strong breakout above ~$80K needed to confirm bullish reversal (CoinDCX)
📊 Indicators Overview
Moving Averages: Bearish bias (sell signals on multiple timeframes) (TradingView)
Momentum: Weak / neutral
Structure: Lower highs → short-term downtrend
⚡ Short Bias Summary
📉 Bias: Bearish to neutral
🔻 Scenario 1: Rejection → drop toward $60K
🔺 Scenario 2: Break above $80K → bullish continuation
🧠 Quick Trading Insight
Short-term traders are watching:
Range trading (65K–75K)
Breakout confirmation before entering big positions