$ETH price shows signs of exhaustion after a strong rally, with technical structure pointing to a possible short-term pullback toward the $2,080 zone.
Ethereum's recent upside momentum is starting to stall, and price action is now suggesting a shift into a corrective phase. According to Crypto Tony, the current structure appears to be completing a fifth wave - a pattern commonly associated with trend exhaustion - raising the likelihood of short-term downside as volatility picks up around the New York open.
The current structure appears to be completing a fifth wave, often associated with trend exhaustion, raising the likelihood of downside movement as volatility builds.
✨The ETH Move That Defined the Structure
The chart shows ETHUSD pushing aggressively higher from below the $2,080 level into the $2,140-$2,150 zone. This rally formed a clear impulsive structure, with consecutive bullish candles driving price upward without any meaningful pullbacks along the way.
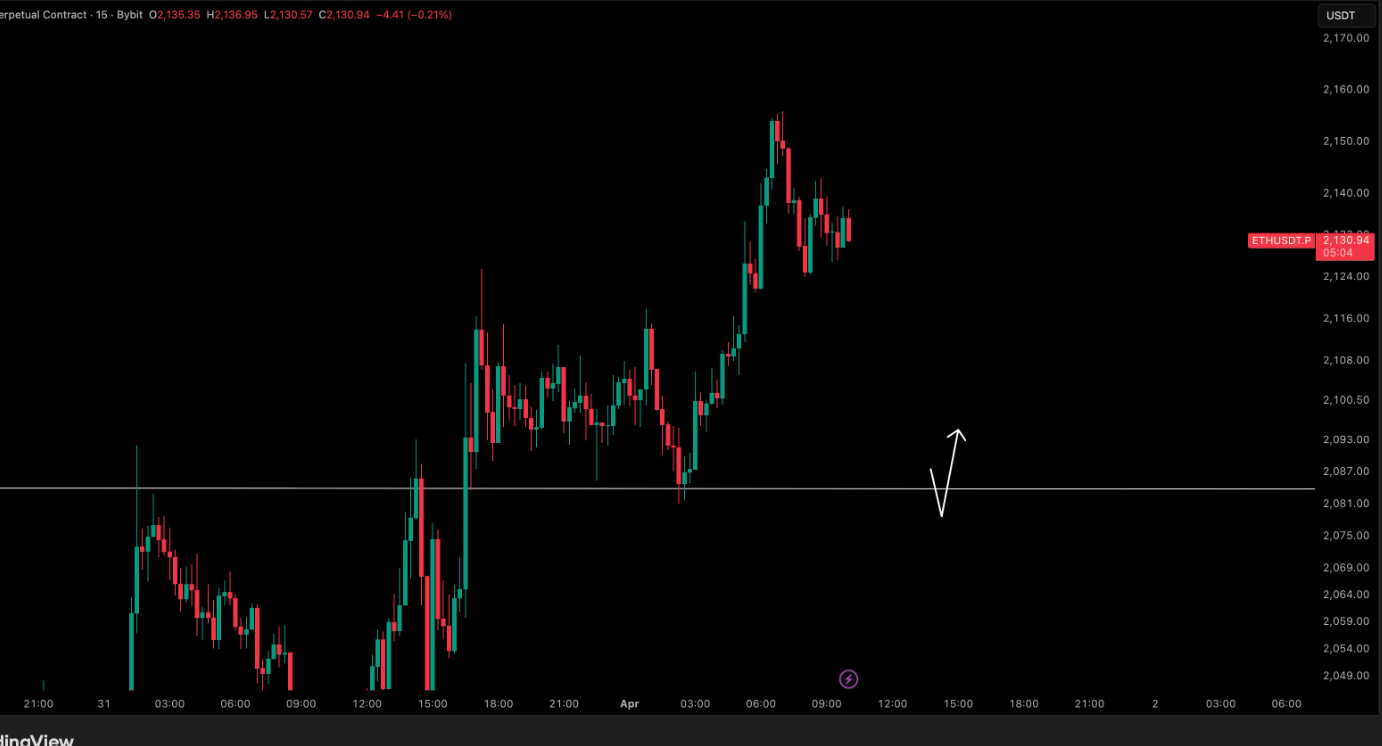
However, the move stalled near the highs. Price stopped printing higher extensions and instead transitioned into smaller-bodied candles - a shift that signals buying pressure is no longer accelerating. This behavior aligns with the idea of a completed upward sequence and raises the question of what comes next.
When momentum fades after a push higher, price often rotates back toward prior support zones before deciding the next direction.
✨A Key ETH Level Now Under Pressure
The horizontal zone around $2,080 stands out as a critical reference point on the chart. It previously acted as the base for the entire rally and now becomes the most immediate downside target if the pullback unfolds as the structure suggests. Recent coverage on how ETH holds $2,000 by a thread highlights just how persistent overhead resistance has remained, keeping sustained pressure on price throughout this range.
Price is currently holding above $2,080, but the structure leaves the door open for a revisit. Similar setups across Ethereum markets have historically shown that when momentum fades after a strong push higher, price tends to rotate back toward prior support before establishing a new directional bias.
✨The Pattern of Fading ETH Momentum
What stands out in the current setup is not a sharp reversal, but a slowdown. After the strong impulse into the $2,150 region, ETH has entered consolidation near the highs rather than continuing higher. The key signals in the structure include:
Strong impulse into the $2,150 region
Loss of follow-through near the highs
Consolidation forming instead of continuation
This type of behavior is a common feature of trend exhaustion, particularly after a completed wave sequence. Prior analyses, such as the breakdown of how ETH holds SuperTrend support, point to similar conditions where price stabilizes but fails to build confirmation for further upside.
✨Volatility Builds Into the Next ETH Move
With ETH hovering near local highs but showing reduced momentum, the market appears to be transitioning into a more uncertain phase. The prospect of a potentially messy New York open reflects this condition - price can move unpredictably as liquidity increases and positions are adjusted.
Periods of consolidation near local highs often precede sharp moves in either direction, and the current setup is no exception.
Broader technical setups, including an analysis of ETH price compression patterns, reinforce the idea that compressed ranges near key levels tend to resolve in decisive fashion. For now, the structure leans toward a short-term pullback scenario, with the rally losing steam and price hovering at levels where previous moves have typically reversed or reset before the next leg develops.
♥️♥️♥️🚀🚀🚀FOLLOW ME 🌍🌎🌏
Appreciate my work. 😍 THANK YOU ! 😘
👉👉👉If You follow me, I'll follow you back as MutualFollow 💥✨🚀🚀🚀🚀🚀
MAKE YOUR ACCOUNT GROW !!! 🌍🌎🌏