
⚠️ Note: To enter a position, you should get confirmations on minute or hourly timeframes before entering. This is a mid-term view, as this coin is volatile and high-risk.
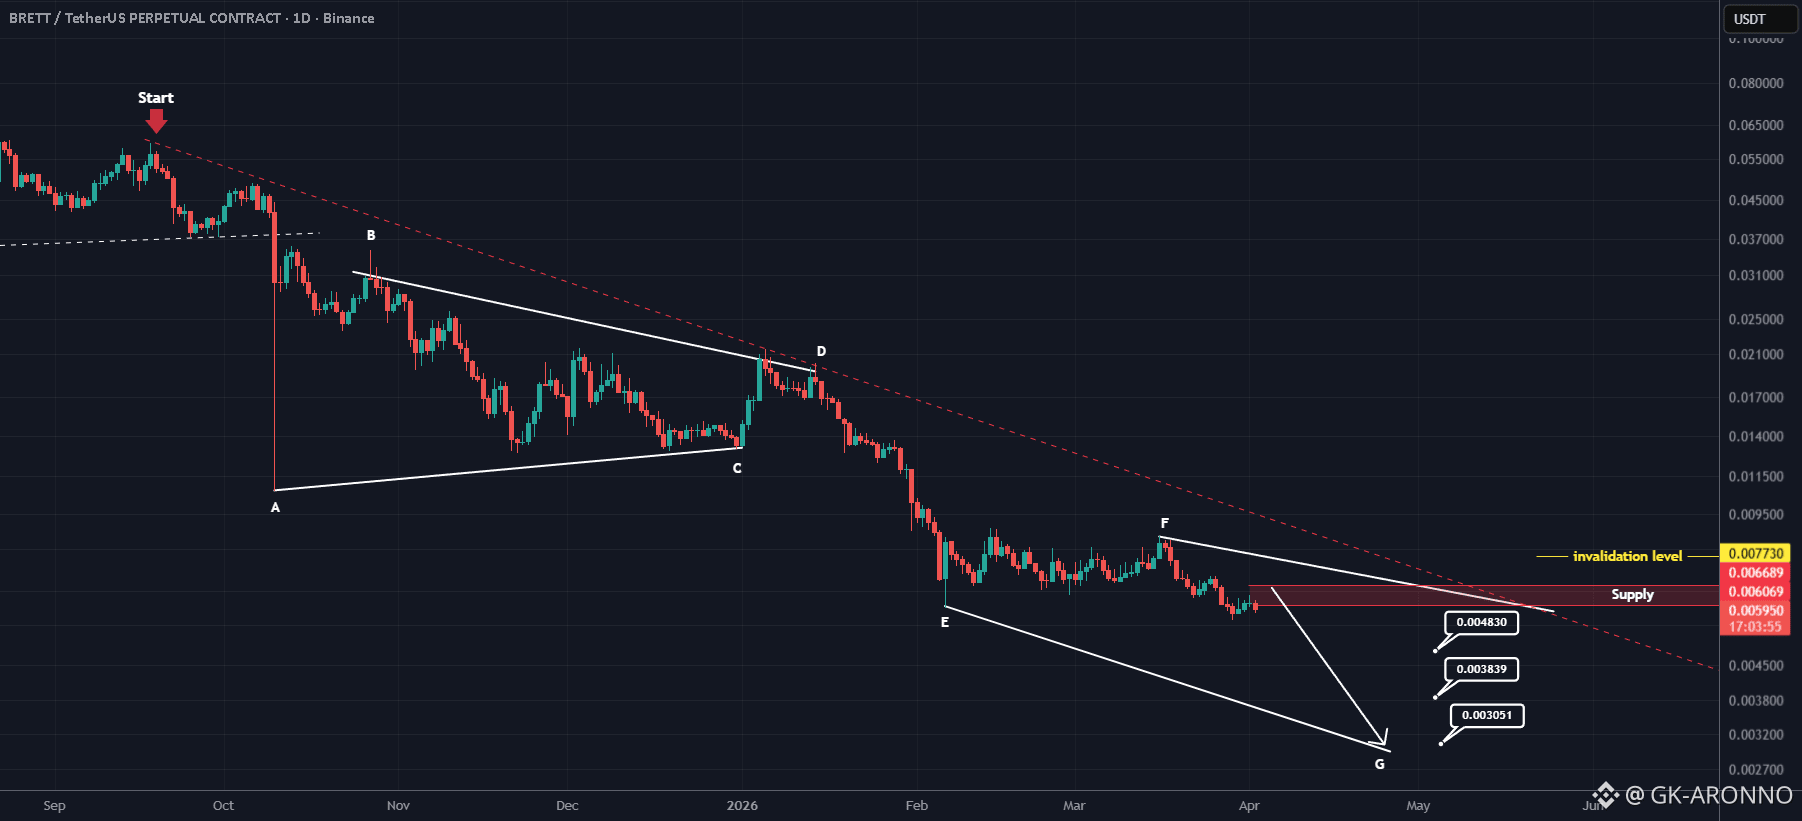
From the point marked as Strat on the chart, it appears that the BRETT correction has begun.
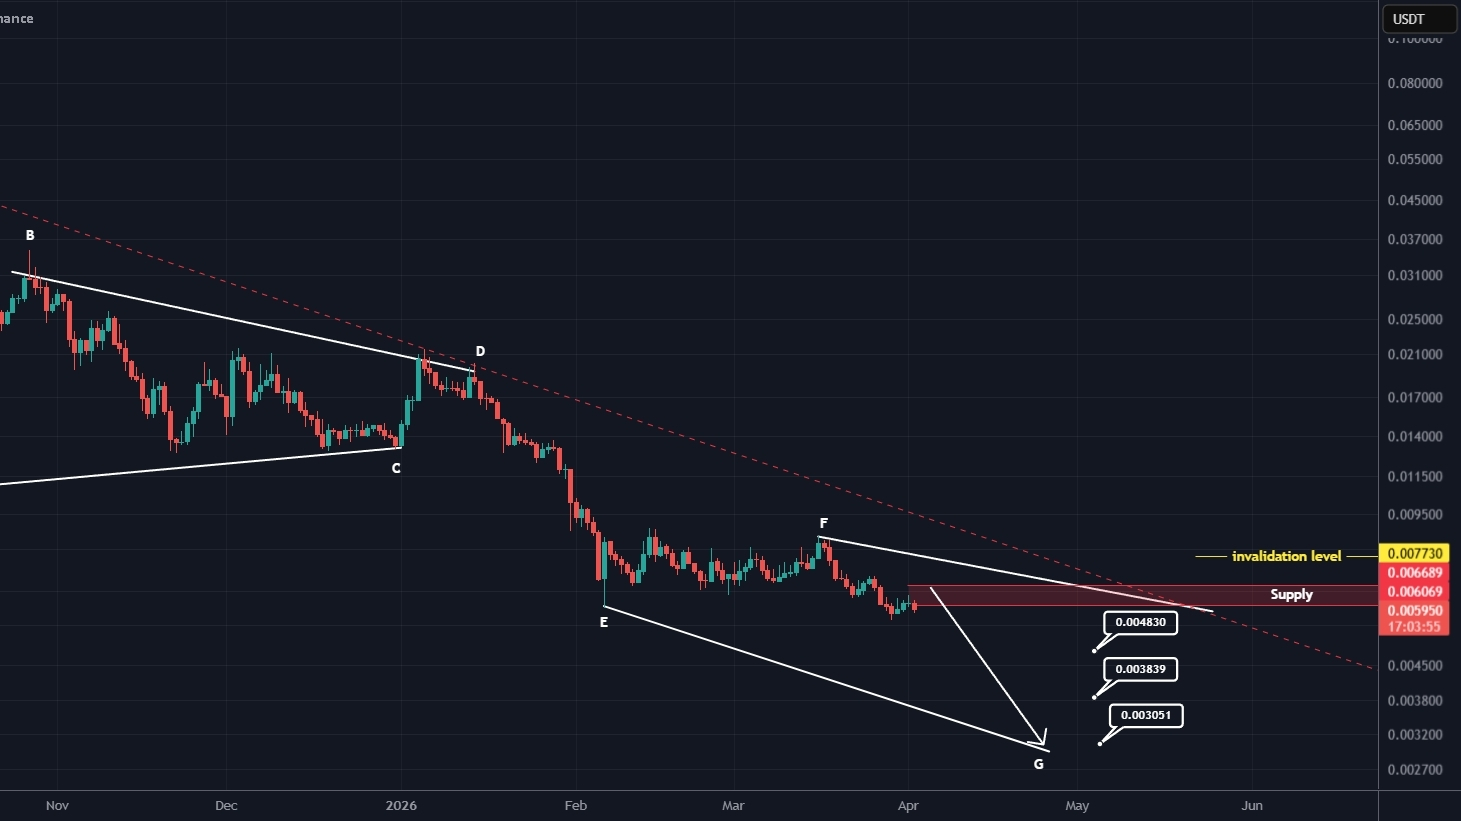
Currently, wave F seems to have completed, and the price has entered wave G, which is a bearish wave.
As long as the red zone holds, the mid-term BRETT trend is expected to remain bullish.
As indicated on the chart, the price is trading below the mid-term resistance line, which we have marked with red dashed lines.
Targets are marked on the chart.
A weekly candle close above the invalidation level would invalidate this analysis.
If you have a coin or altcoin you want analyzed, first hit the like button and then comment its name so I can review it for you.
Do you also think BRETT is bearish?