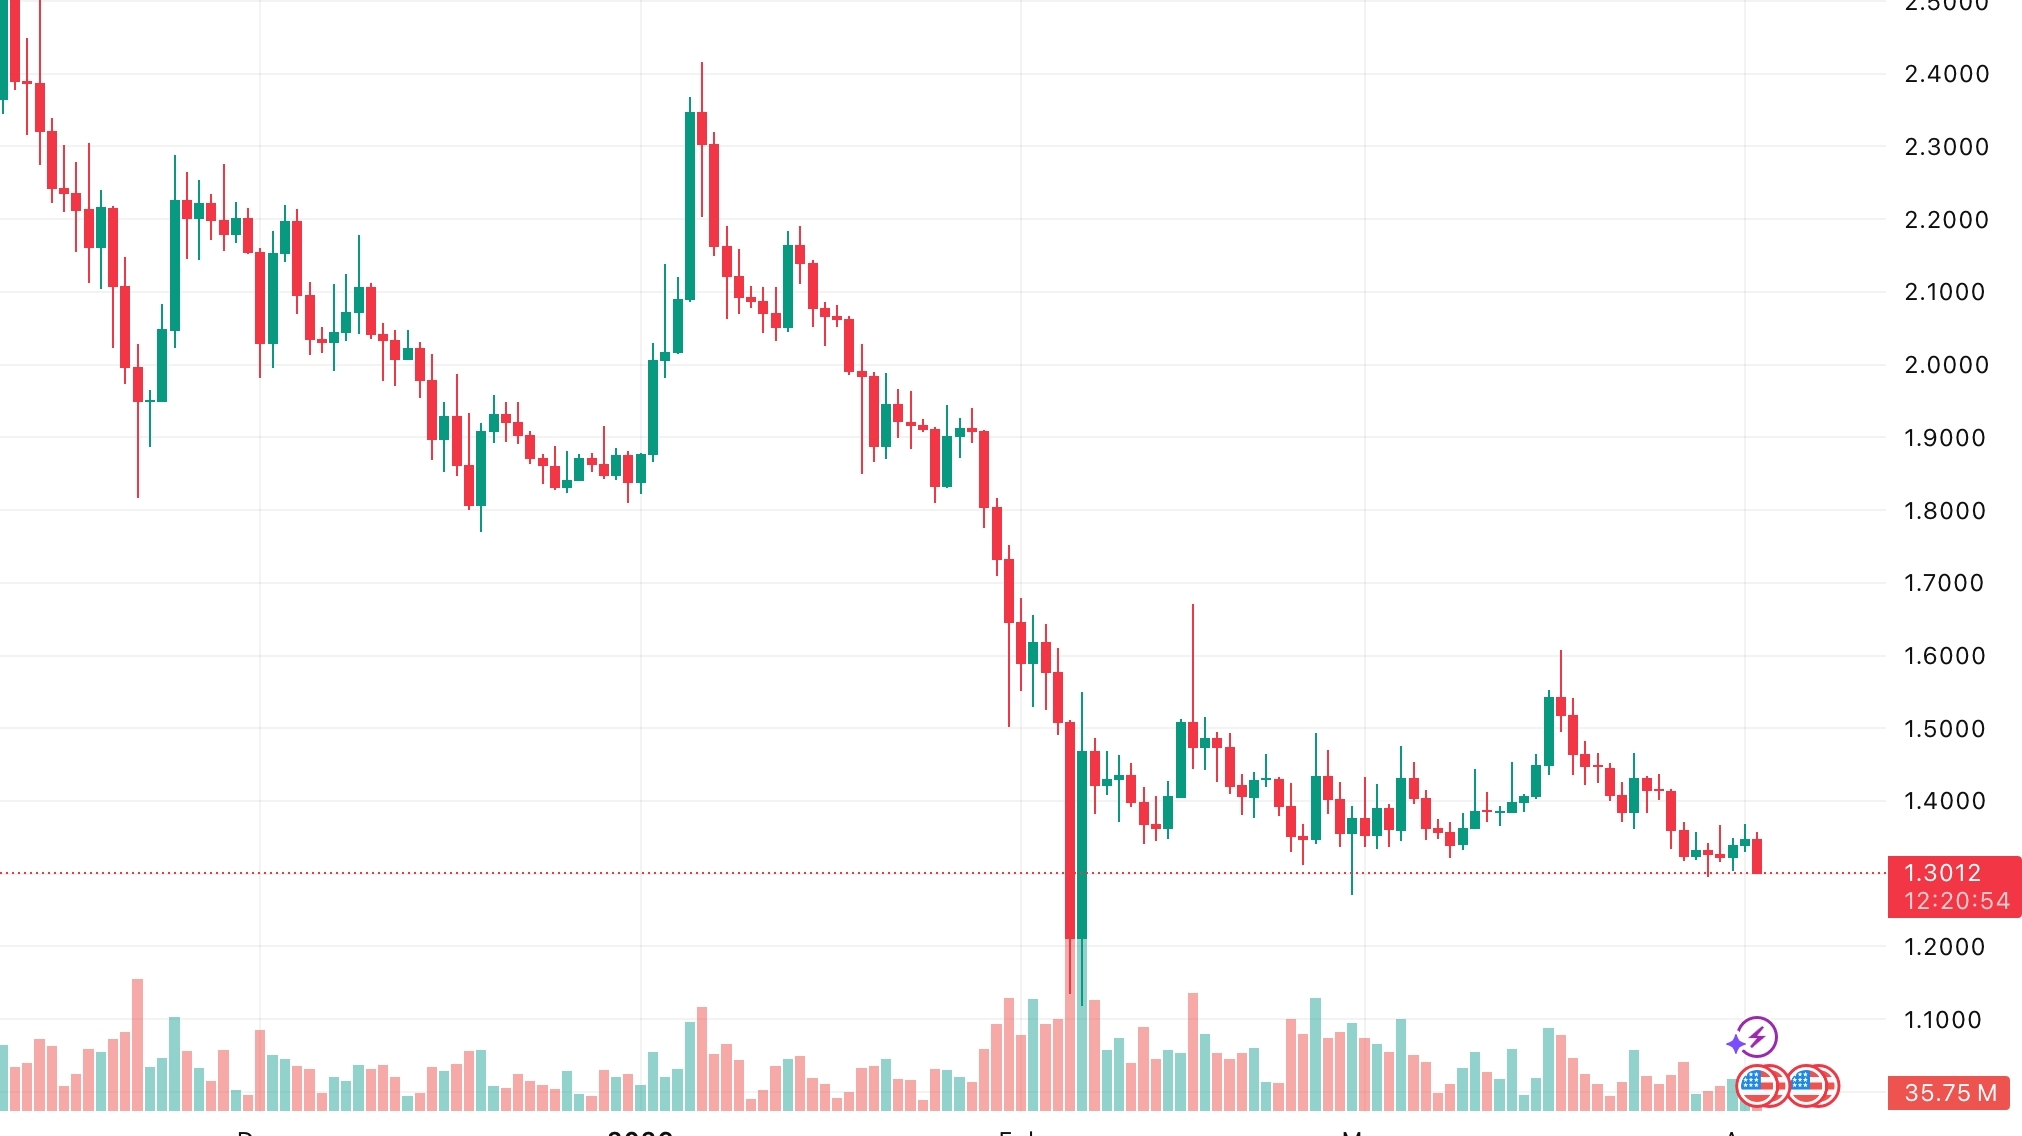


The XRP/USD pair has broken below the multi-month sideways range of 1.5625–1.3671, where price had remained for more than two months. This breakdown signals growing bearish pressure and increases the probability of further downside.
The next key level for sellers is 1.3000, which previously served as March support.
⸻
Bearish Momentum Strengthens
If price breaks below 1.3000, further decline may target:
• 0.9765 (Murrey [5/8])
• 0.7812 (Murrey [4/8])
Meanwhile, buyers are focused on the 1.5625–1.6420 resistance zone. A recovery above this range could trigger:
• 1.9531
• 2.3437
Such a move would signal a potential trend reversal.
⸻
Technical Indicators
Indicators provide mixed signals:
• Bollinger Bands: horizontal
• MACD: expanding negative histogram
• Stochastic: turning upward from oversold
Weekly chart:
• Downward Bollinger Bands
• Bearish flag pattern forming
➡️ Medium-term bearish trend remains dominant
⸻
Key Levels
Resistance
• 1.5625
• 1.6420
• 1.9531
• 2.3437
Support
• 1.3000
• 0.9765
• 0.7812
⸻
Trading Scenarios
Bearish Scenario
Sell below 1.3000
• Entry: 1.2830
• Targets: 0.9765 → 0.7812
• Stop-loss: 1.4900
• Timeframe: 5–7 days
⸻
Bullish Scenario
Buy above 1.6420
• Entry: 1.6500
• Targets: 1.9531 → 2.3437
• Stop-loss: 1.4200
⸻
Outlook
XRP remains under pressure after breaking below the multi-month range:
• Break below 1.3000 → bearish continuation
• Recovery above 1.6420 → bullish reversal
Short-term outlook remains bearish.
